How to integrate IT service integrations with zabbix
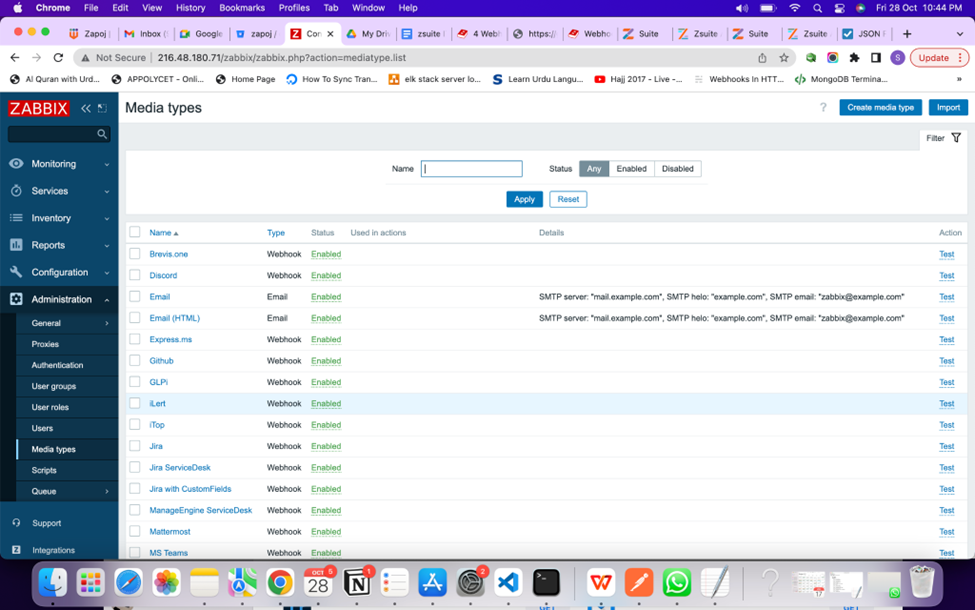
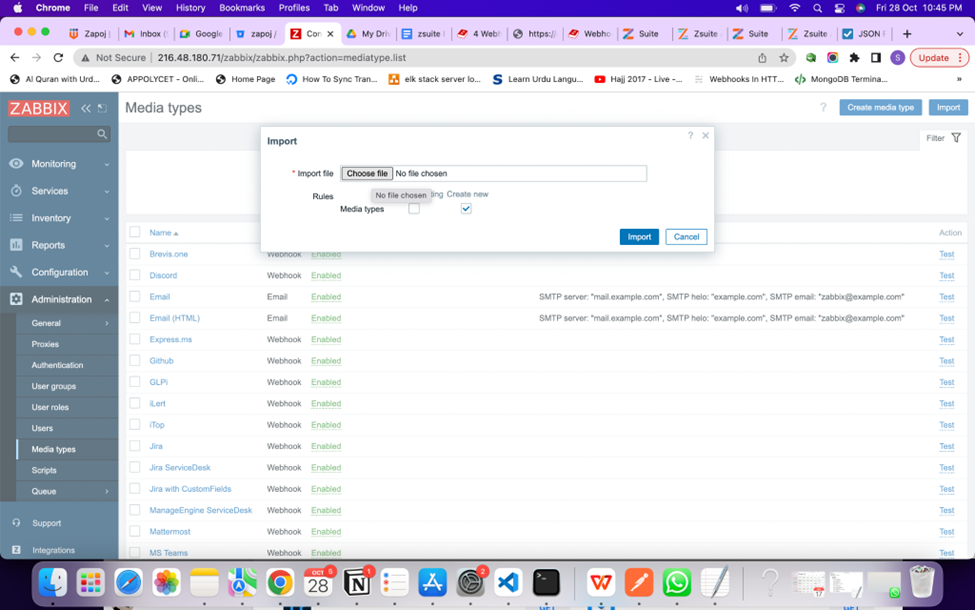
Login to Zabbix and click on Administration → Media types
2. Click on “import’ button at top right corner → and click on “Choose file”
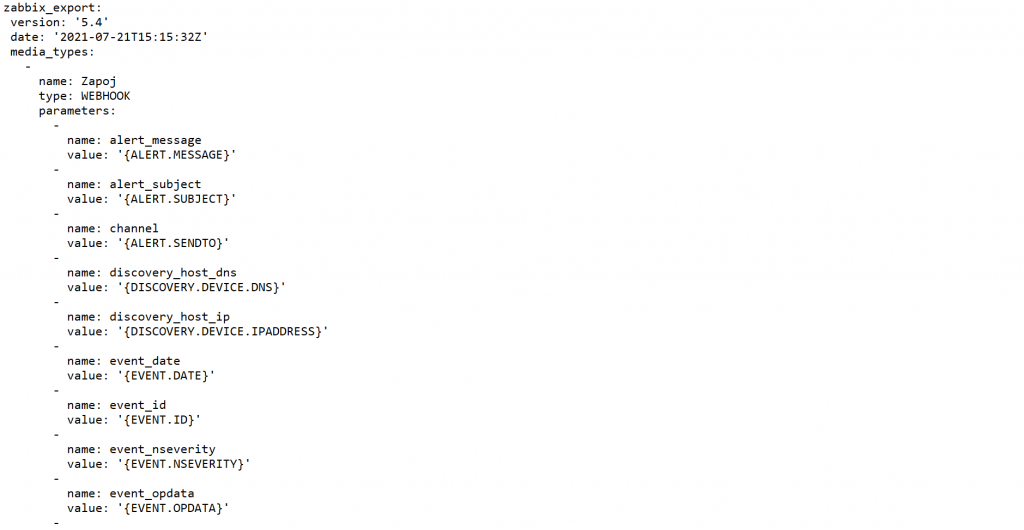
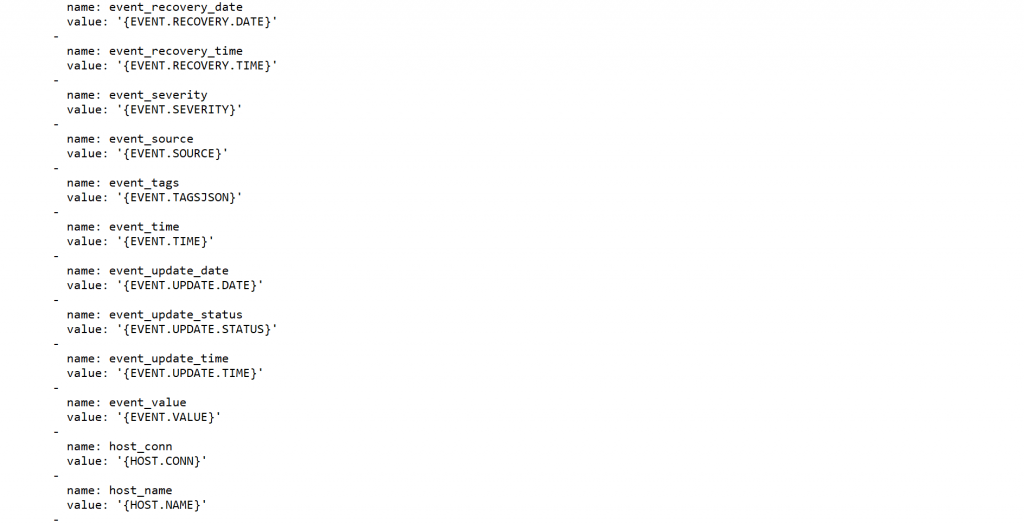
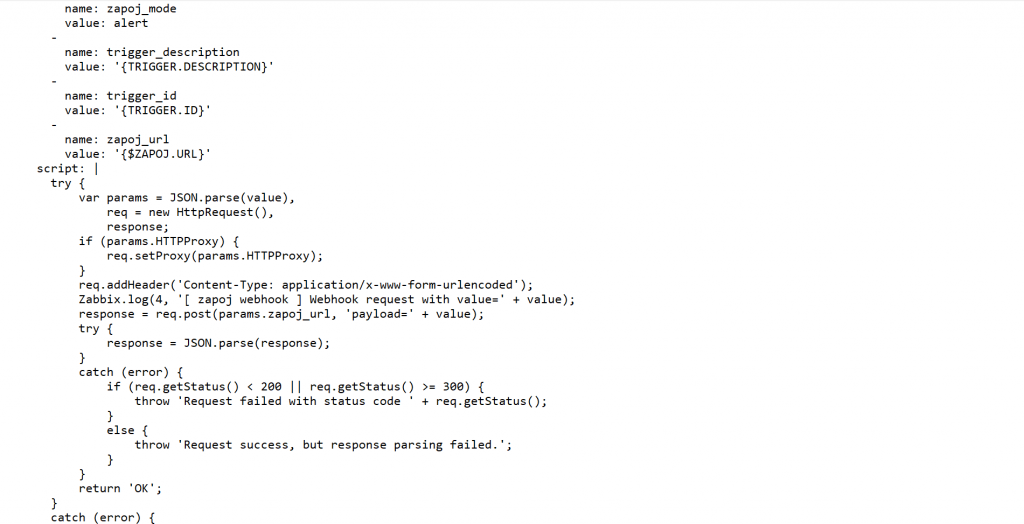
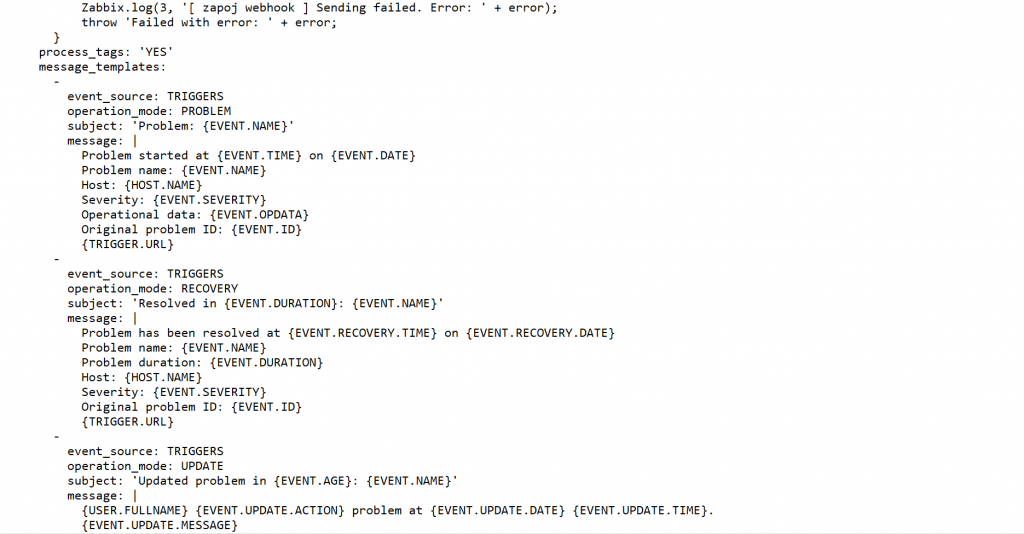
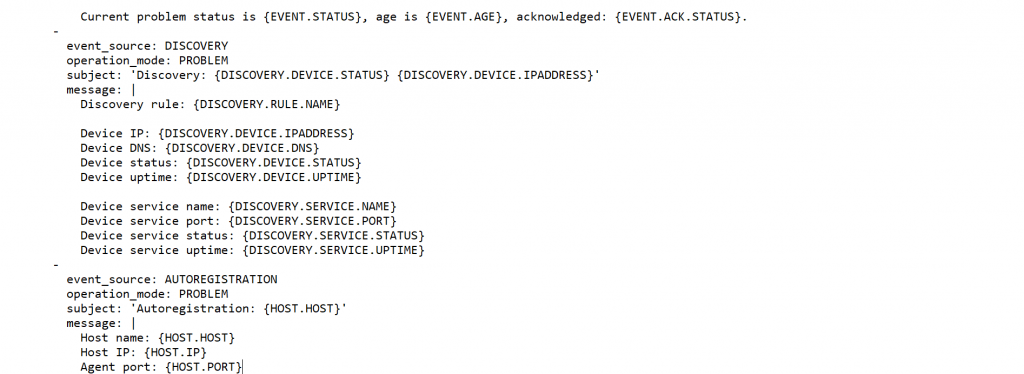
3. Create zapoj.yaml file with the below script and upload the file
Note : if you want to change the name of the media type, in the below script at the media types : name : update the name.
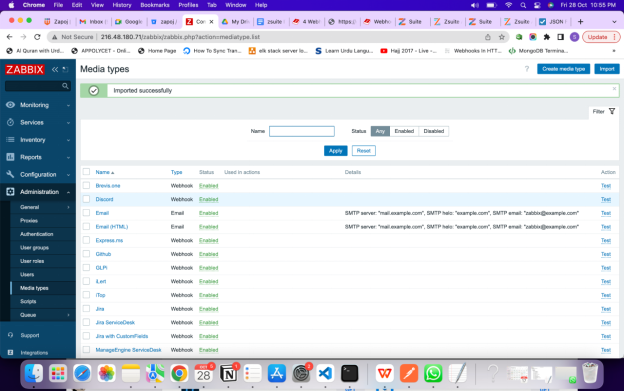
4. It will create the new media type in the list of media types
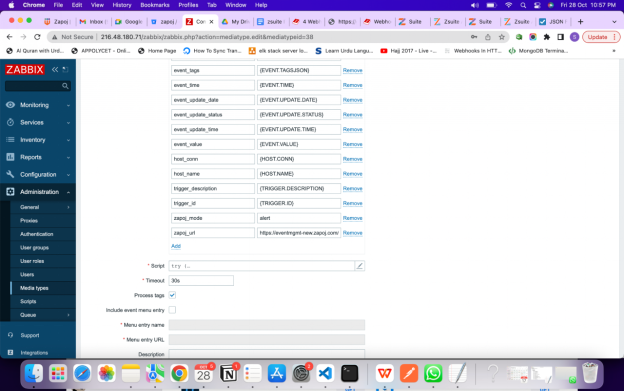
5. Click on the “ZAPOJ” media type and paste the integration URL at zapoj_url parameters and click on the Update button.
Note : You can create multiple media types based on your requirements, for each service you can create one media type and name it a service name, assign the required media types to users
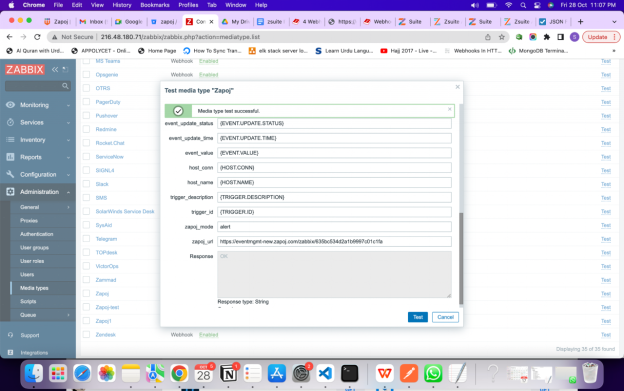
6. To test the media type please click on “Test” at the right side corner of media type, and click on “Test” button.
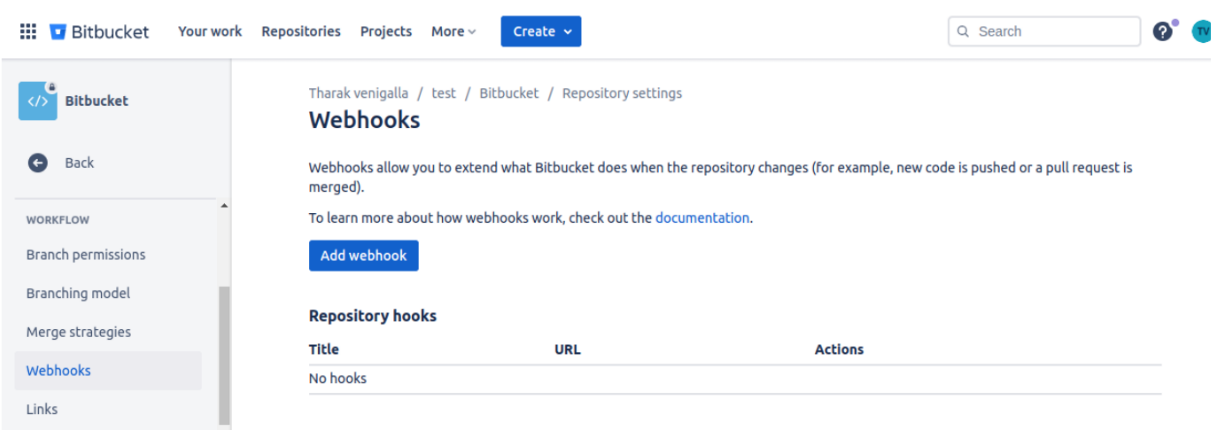
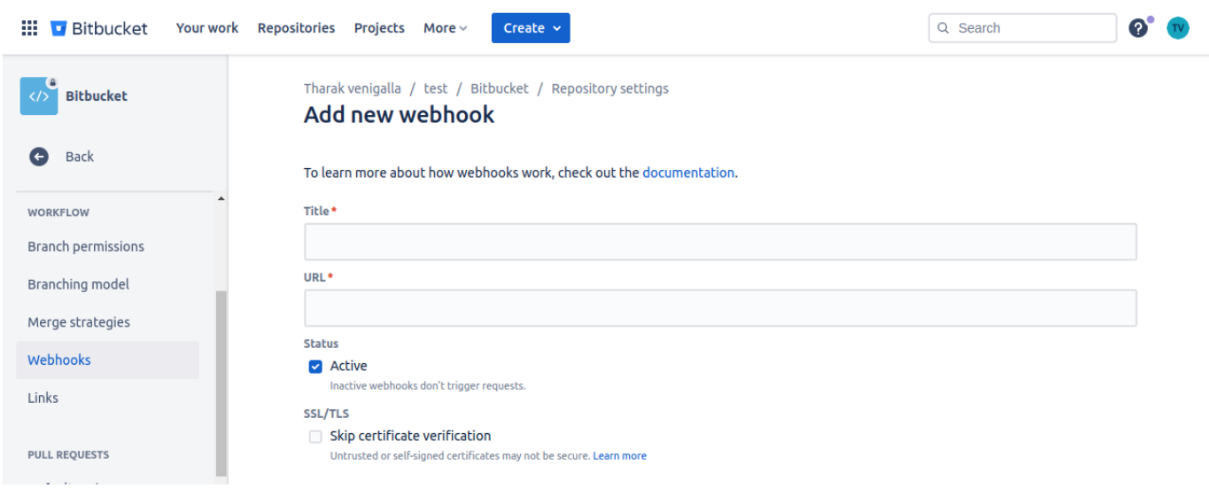
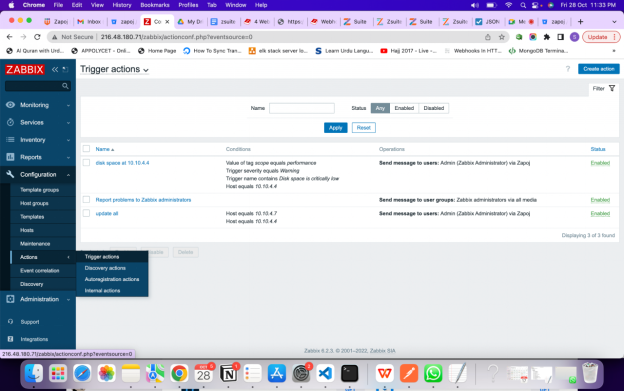
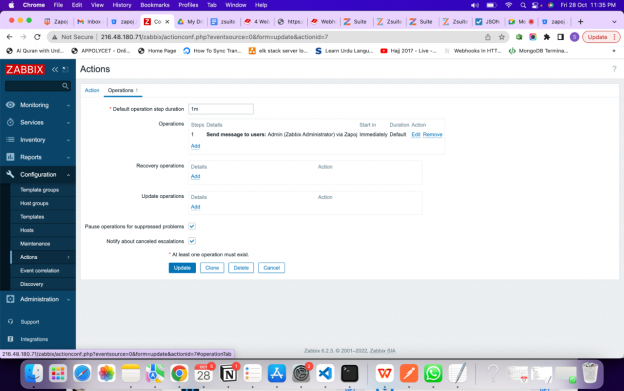
7. Add this media type into Configuration → Actions → Trigger Actions
8. Click on Create action button at top right corner or click on already created actions list
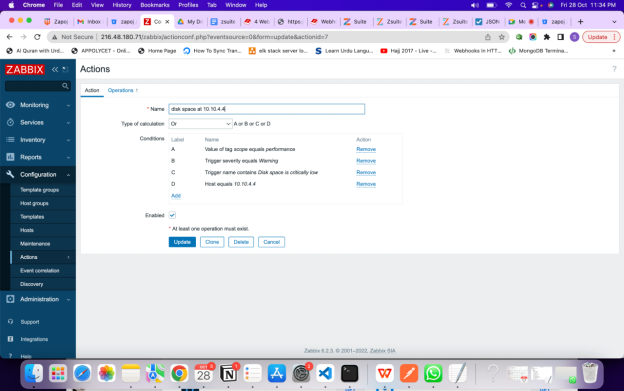
9. You can create the conditions based on the information displayed in the below table
10. Give the required details and conditions in which you want to get the alerts and click on Operations menu right to the action menu
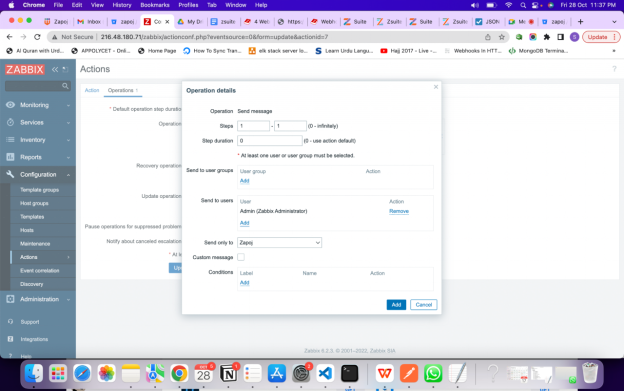
11. Under Operations test area click on Add Button new pop up will open
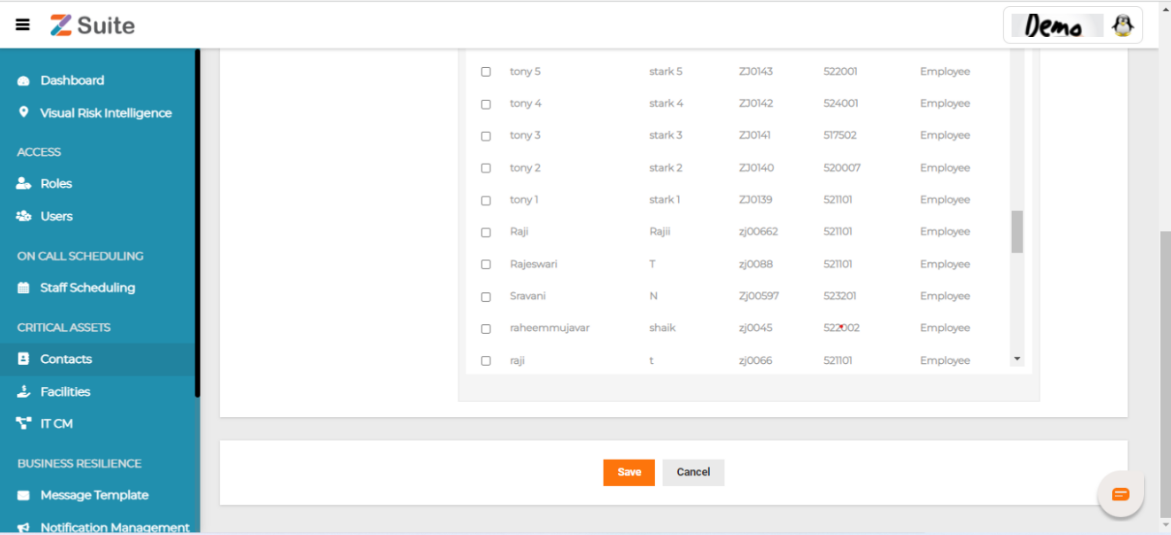
12. Add at least one user group or one user to the operation details
13. Select “Send only to” select menu under that you will get the list of media types and select “Zapoj” media type.
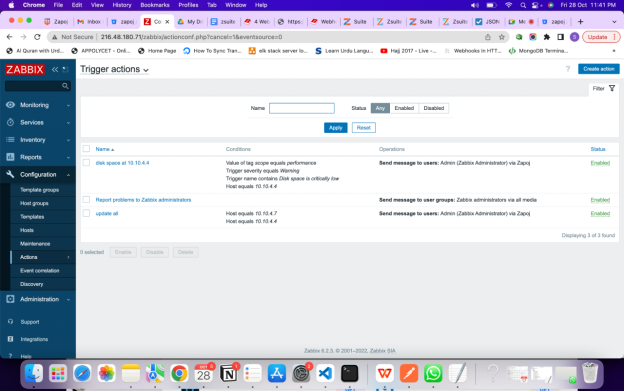
14. After creating the action you will see the new action will be listed in the list, whenever any trigger happens then you will get the information at zapoj application
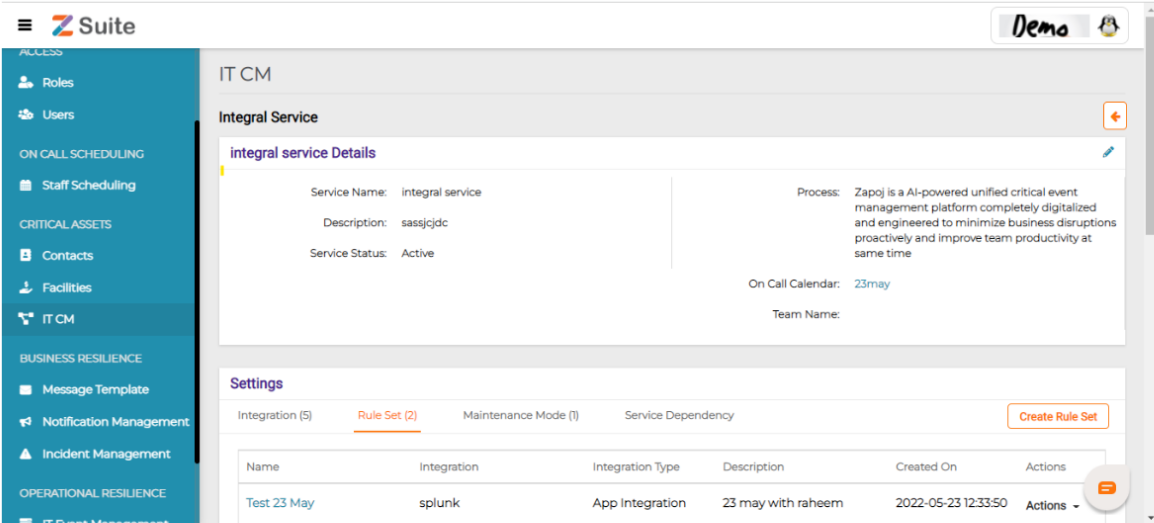
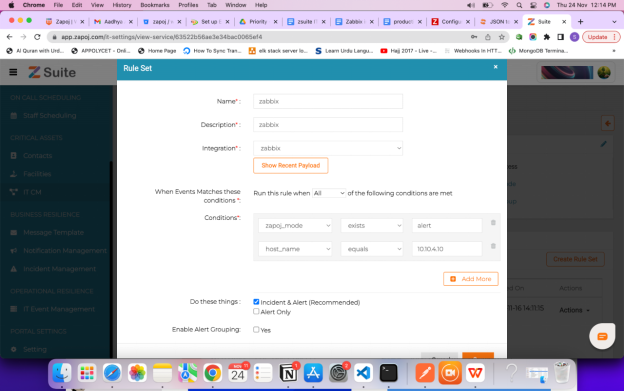
15. Now you can create rulesets based on the data you are receiving at zapoj application.
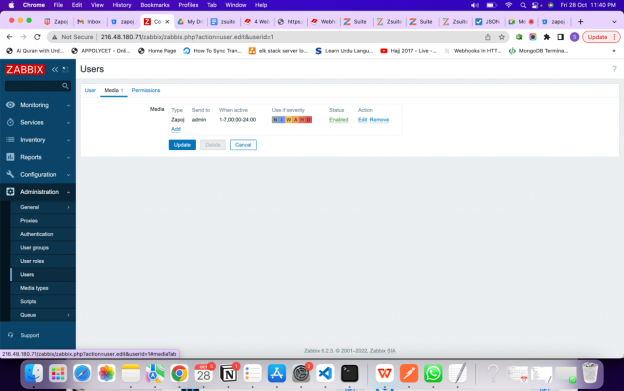
16. At each user append any media type at Administration → users and at media menu
17. In each service rulesets add this rule conditions like the below screenshot
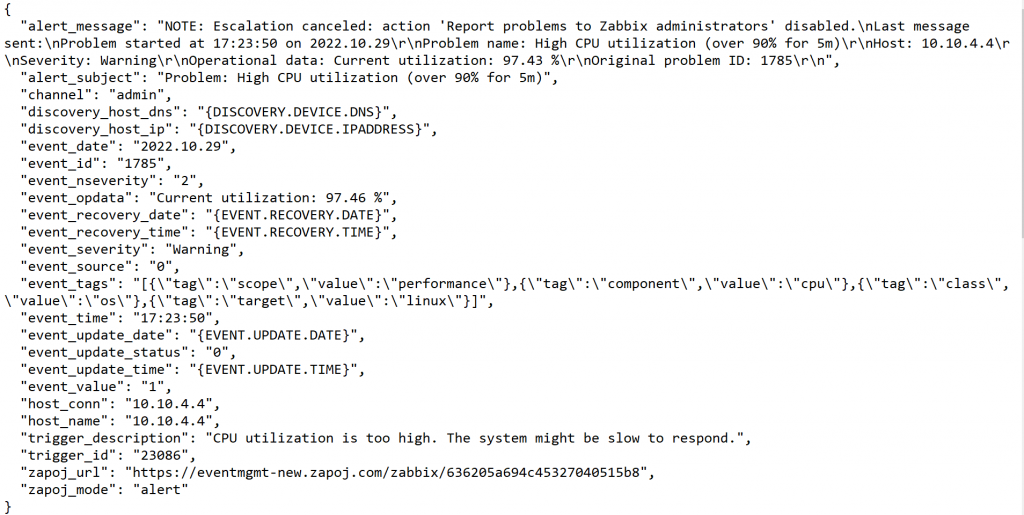
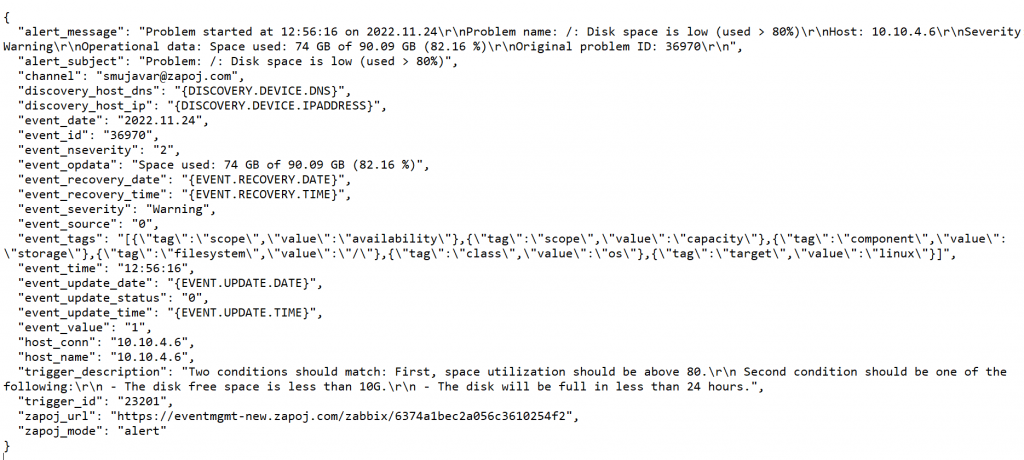
Event-Out parsed Objects :
ManageEngine (OpManager)
ManageEngine (OpManager)
Reference link for download and install manageEngine :-
In the installation steps accept the license and add the technical supported person detail ( name, email, phone number , country etc) and follow the instructions
Step 4:- Start opManager as a service
cd /opt/ManageEngine/OpManager/bin
sudo ./linkAsService.sh
sudo systemctl start OpManager.service
Step 5:- check the status of opManager
sudo systemctl status OpManager.service
Step 6:- Stop opManager
sudo systemctl stop OpManager.service
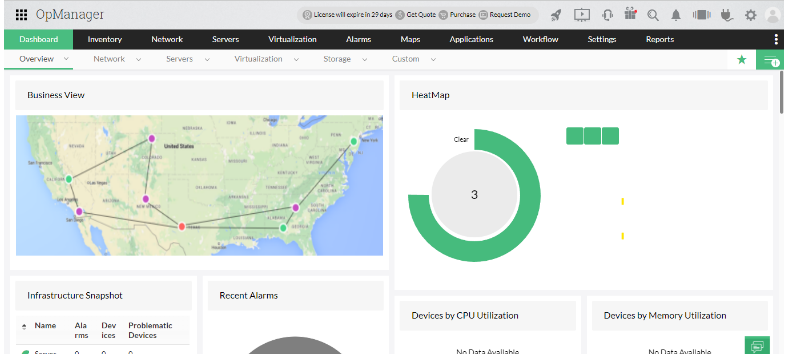
Now you successfully installed opManager go to the browser and open opManager dashboard using ipAddress
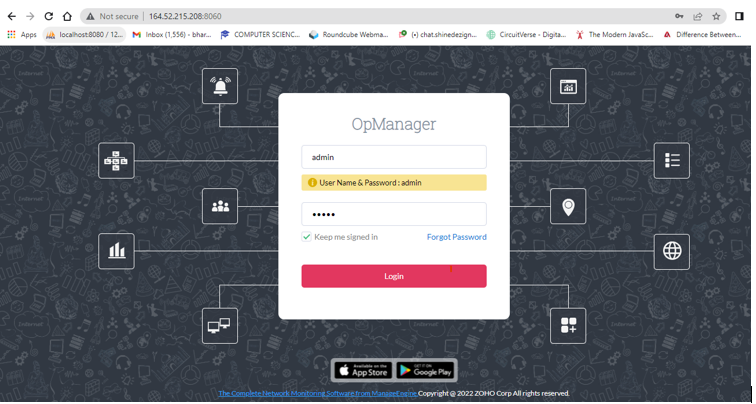
Fill the credentials of opManager default user Name:- admin password :- admin
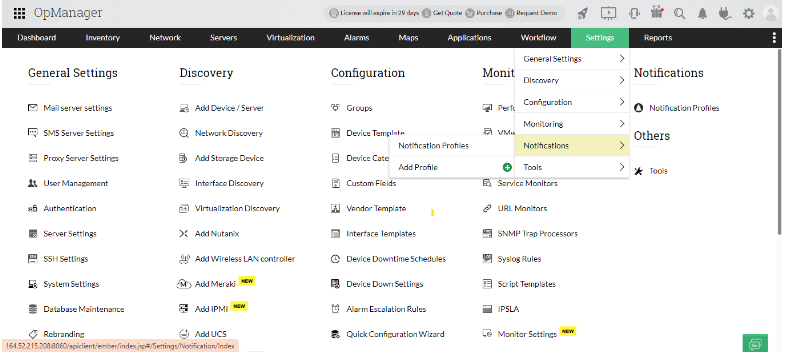
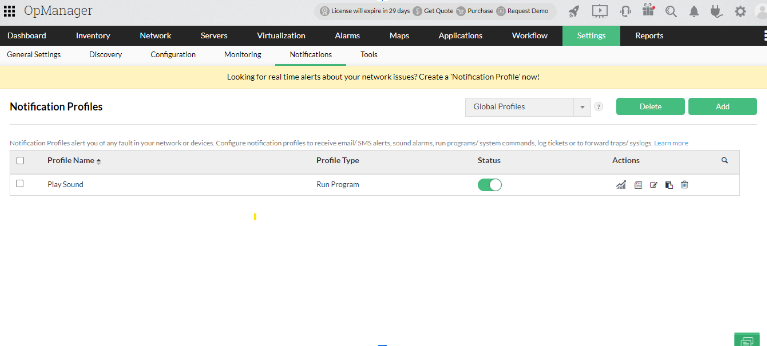
Steps to configure webhooks in opManager:
Reference Link :- https://www.manageengine.com/network-monitoring/webhook-integration.html
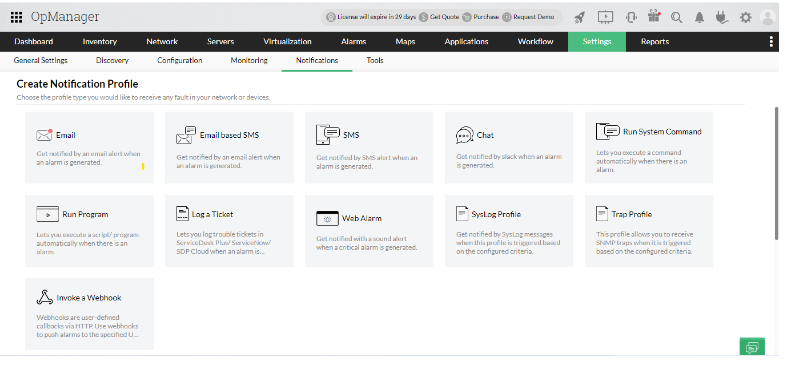
Step 2:- Create new notification click on Add button
Select the invoke a webhook option
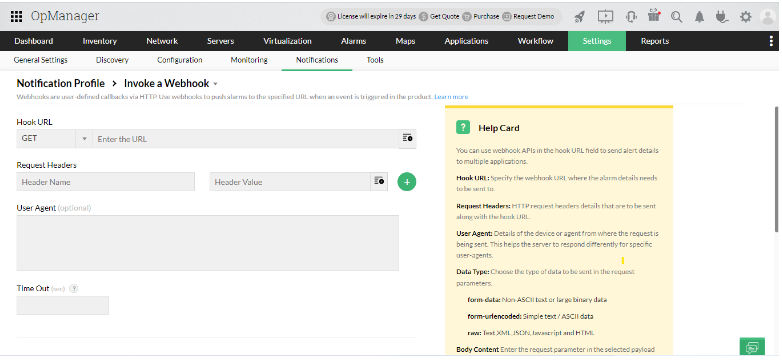
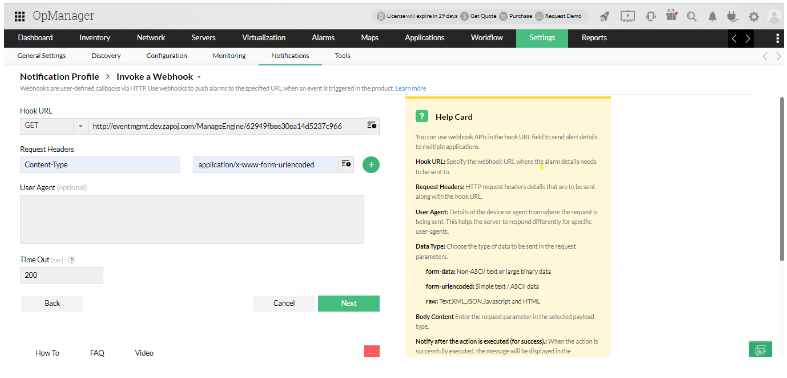
Step 3:- Add the webhook url into the Link url field and other details. Click on next button.
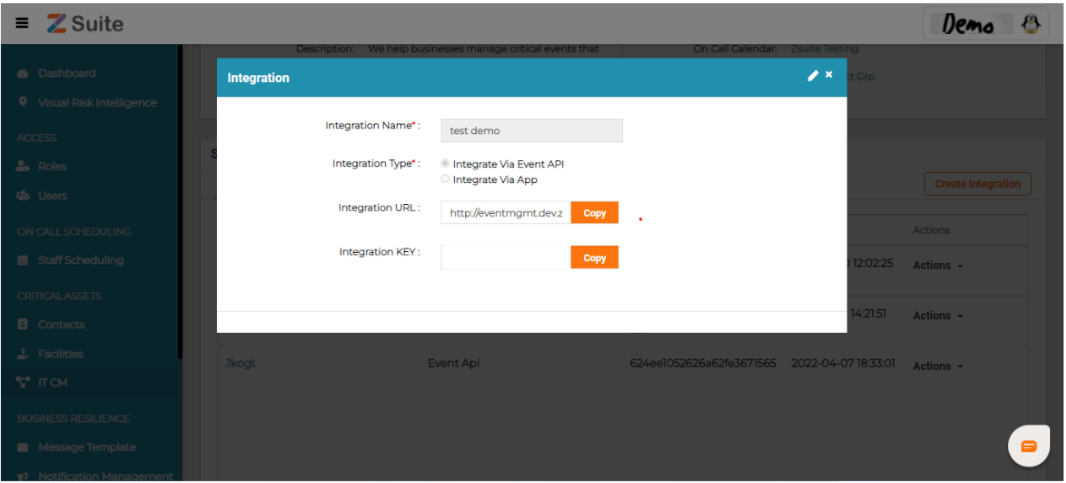
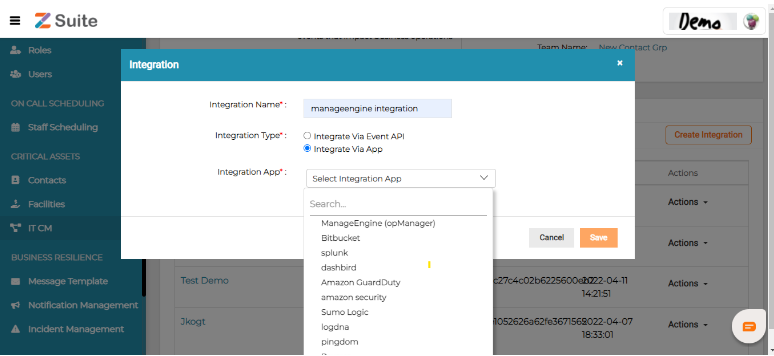
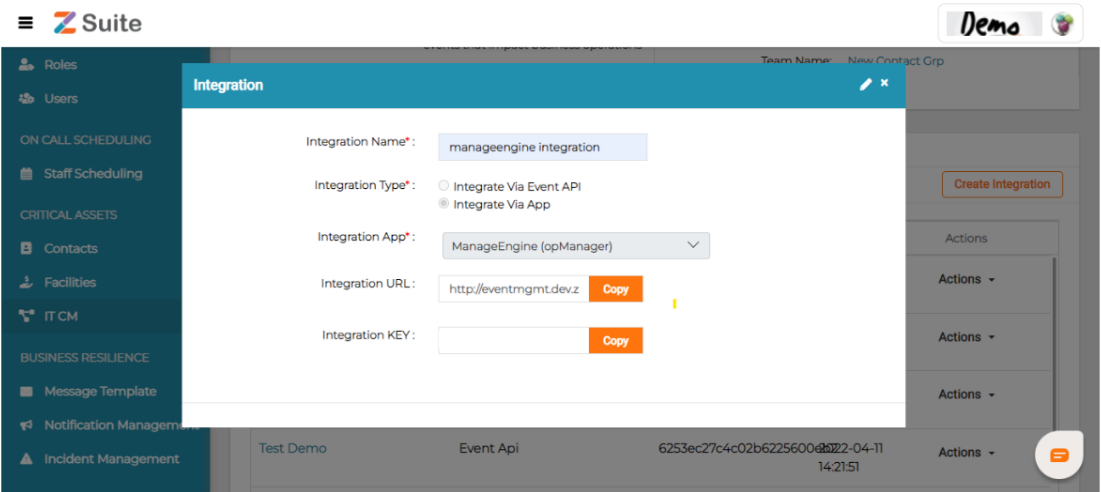
Note:-> Webhook url It CM-> Services->create integrations->fill the integration name and select integration via app or select the manageEngine( opmanager)
Save the integration then the webhook url automatically generated.
Copy this webhook url and add it to the notification profile.
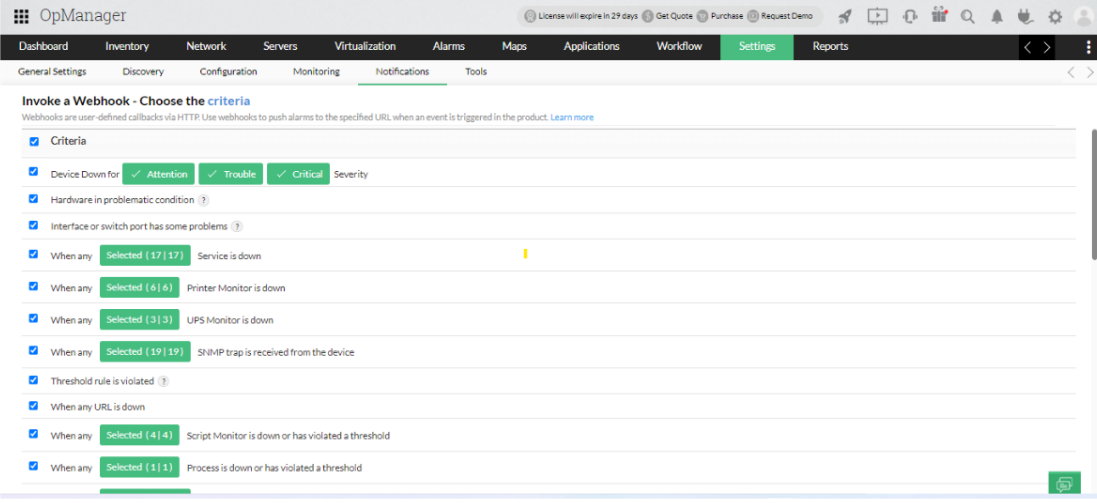
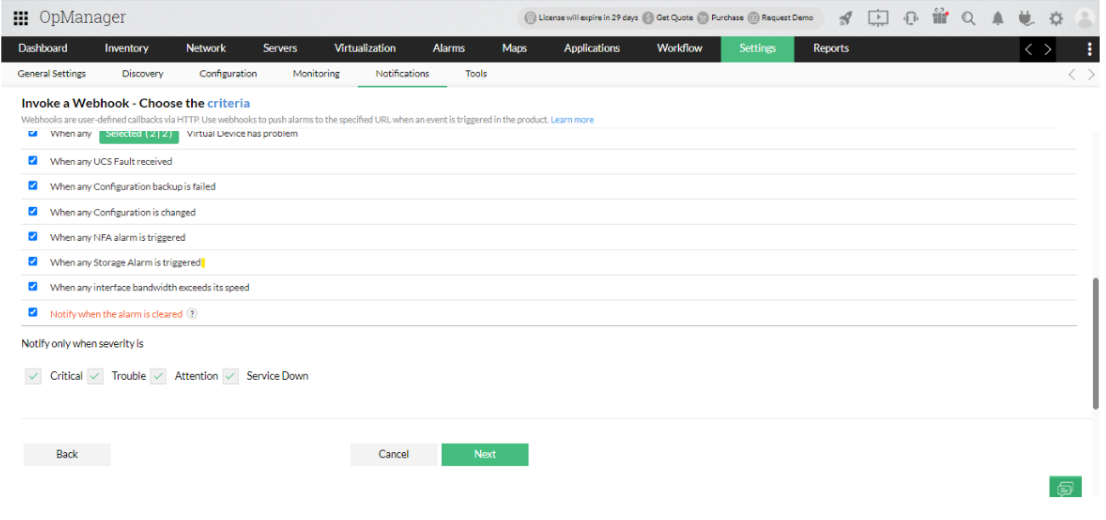
Step 4:- choose the criteria -> click on next button
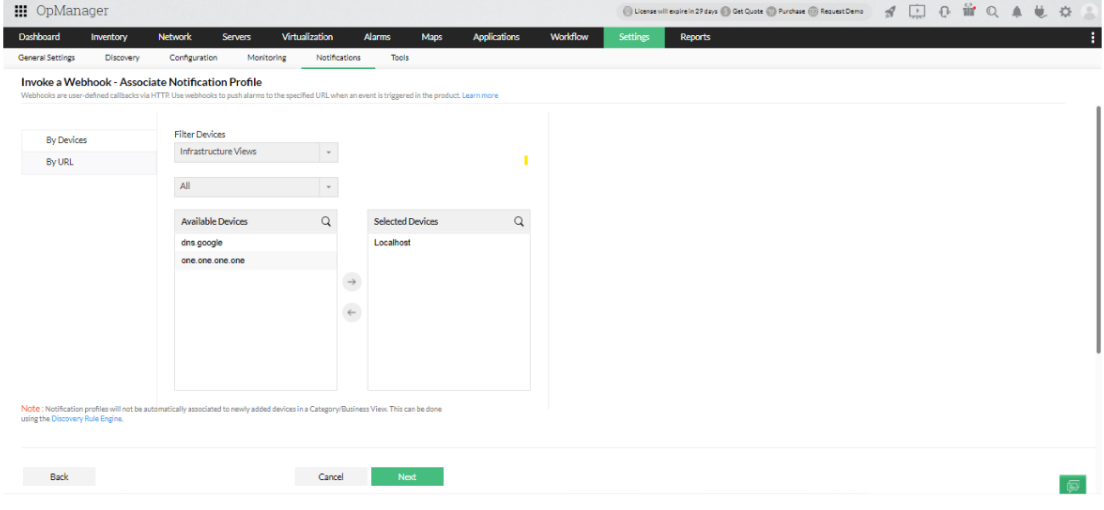
Step 5:- select filter Device and available devices -> next
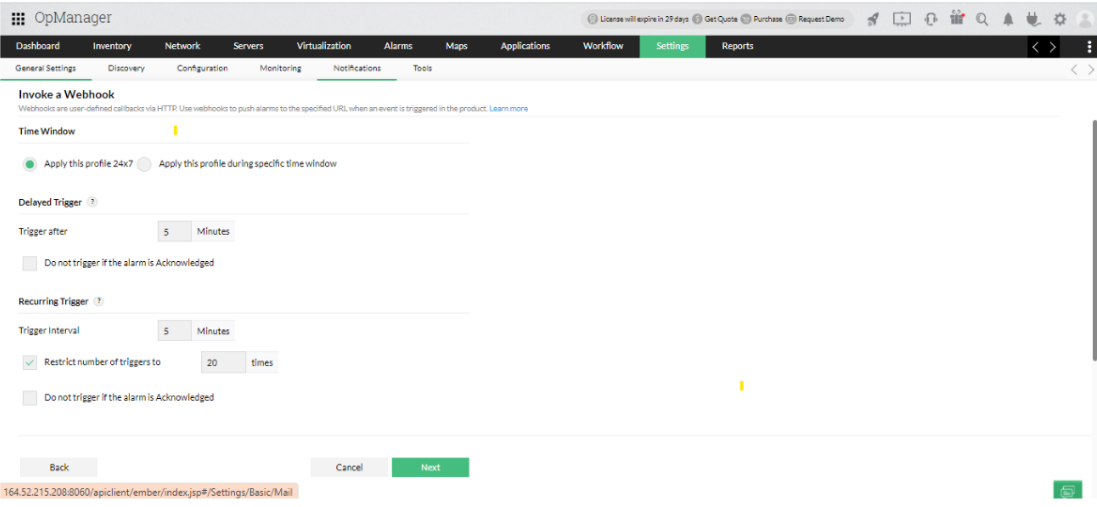
Step 6:- fill the all details about the time of trigger the actions etc -> next
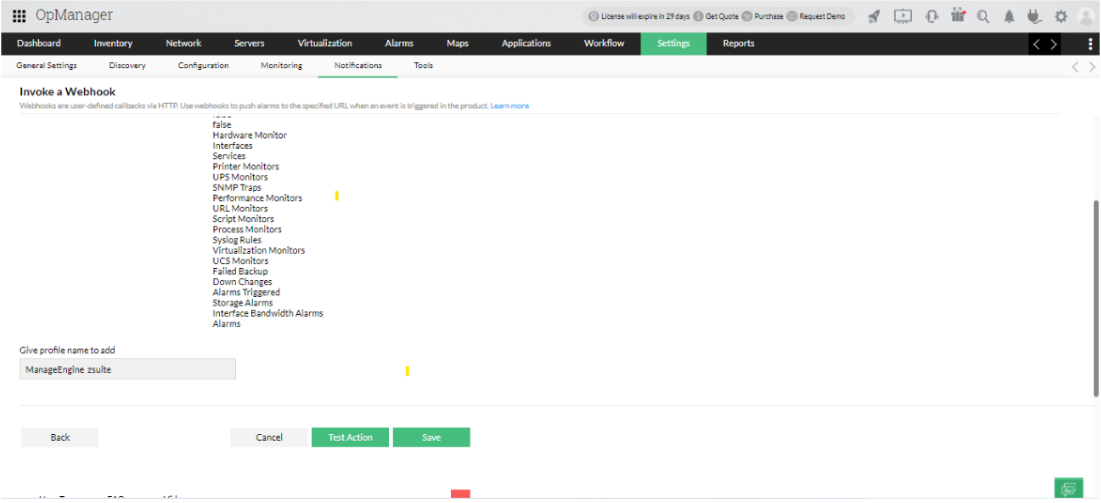
Step 7:- Add profile name Now we have two option test action and save
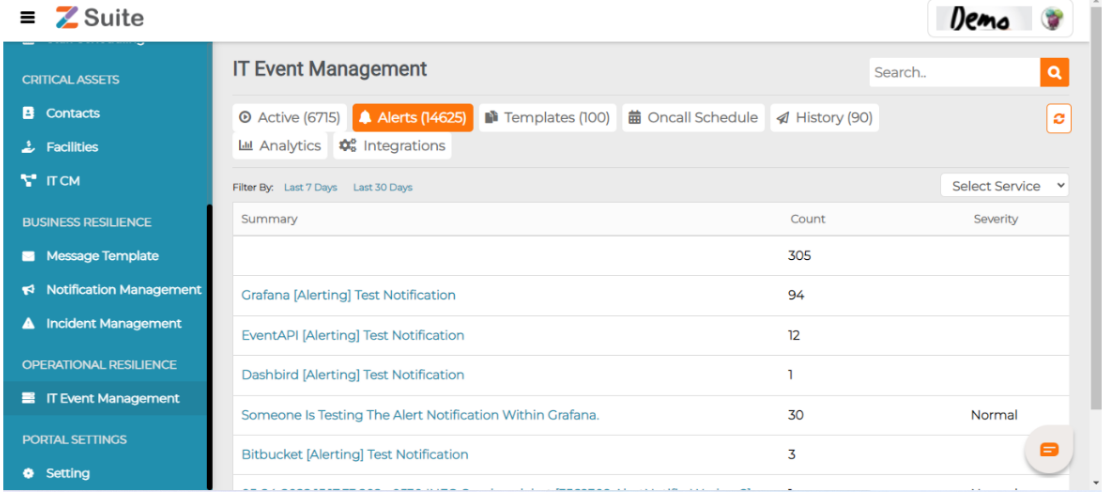
Test action:- On the submit test action the related action will be performed forcefully and shows result in zsuite app but it shows only number of counts particular hit action not a complete detail. Zsuite App -> It Event Management -> Alerts
Before test action hit:
After test action hit:-
Save Button :- On the submit of save button action perform when the criteria match with the conditions. situs sultan69
IT Event Management Terminology
IT Event Management Terminology
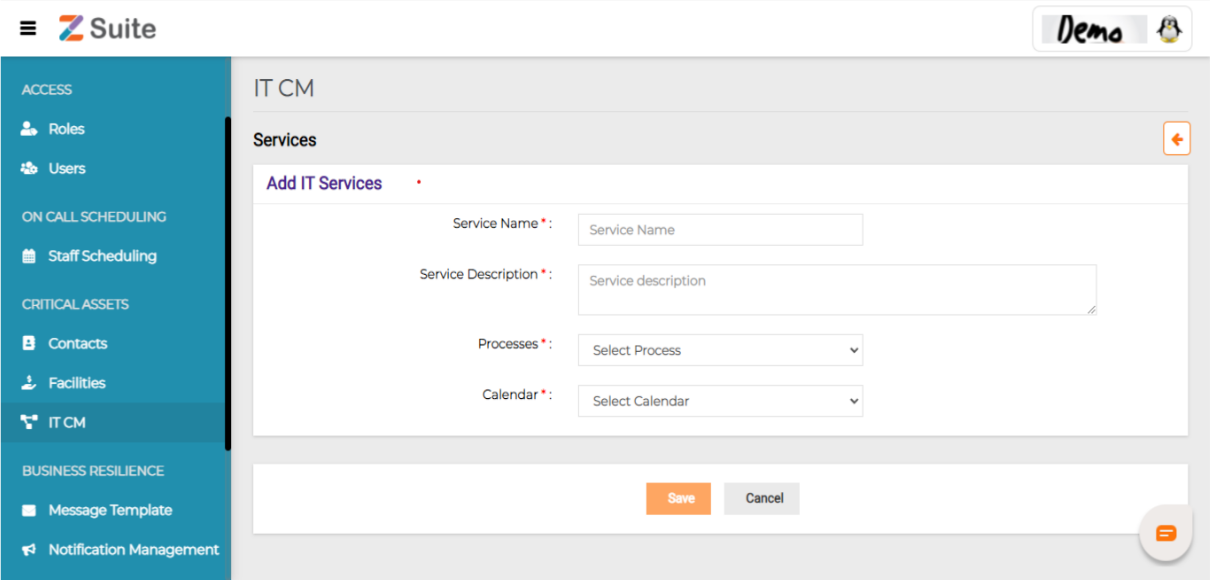
Processes: Processes or functions that are aligned with IT organizational structure. For example, Application development is a Process where various teams develop and maintain the application for a specific service. Similarly , Operations , Service or Help desk , Disaster Recovery & Business Continuity are various Processes involved.
Services : Each Process is subdivided into multiple services and each service is assigned with a Team to develop or maintain or operationalize it. For more information , please check Fresh services.
Integration: Integration Platform as a Service (iPaaS), will provide easier means of integrating various existing ITSM or IT Monitoring or IT Task Management tools to Zapoj IT Event Management . Zapoj will utilize Build.io (iPaaS) via Embed option, so that Zapoj IT Event Management users can easily (using click drag) integrate their existing tools described above. Each Service can have multiple integrations.
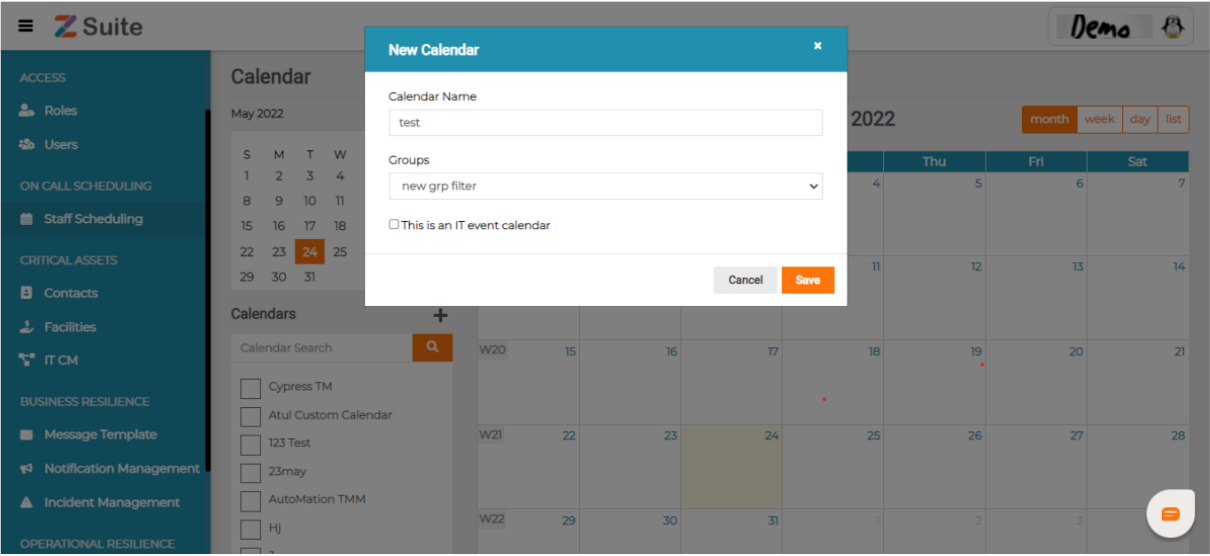
Staff Schedule Calendars : Each ITIL Service is assigned with a Team of Members , who had required skills to Manage particular service . Staff Schedule Calendars provide functionality to assign either regular or on call support for a specific Member of Team .
Alerts: Alerts are the messages generated from Monitoring Tools for a specific Service . Alerts can be classified based on their severity (Critical , Error , Warning , Info) .
IT incident: IT incident is an unexpected IT event that disrupts business operational processes or reduces the quality of service.Every Incident must belong to a Specific defined ITIL Service. Incidents can be created manually by the Incident Management Team Operator or by ITSM or Monitoring tools (via iPaaS) .
IT Alerts: IT Alerts are the consolidated and automated alerts that emanate from mission-critical systems. IT alerting also focuses on communicating these alerts to incident responders.
IT Incident Analytics: IT incident analytics is a structured report of data to assess what happened, how and why it happened, and what can be done to reduce the risk of recurrence through lessons learned.
ITIntegration: Integration Platform as a Service (iPaaS), will provide easier means of integrating various existing ITSM or IT Monitoring or IT Task Management tools to Zapoj IT Event Management . Zapoj will utilize Build.io (iPaaS) via Embed option, so that Zapoj IT Event Management users can easily (using click drag) integrate their existing tools described above. Each Service can have multiple integrations.
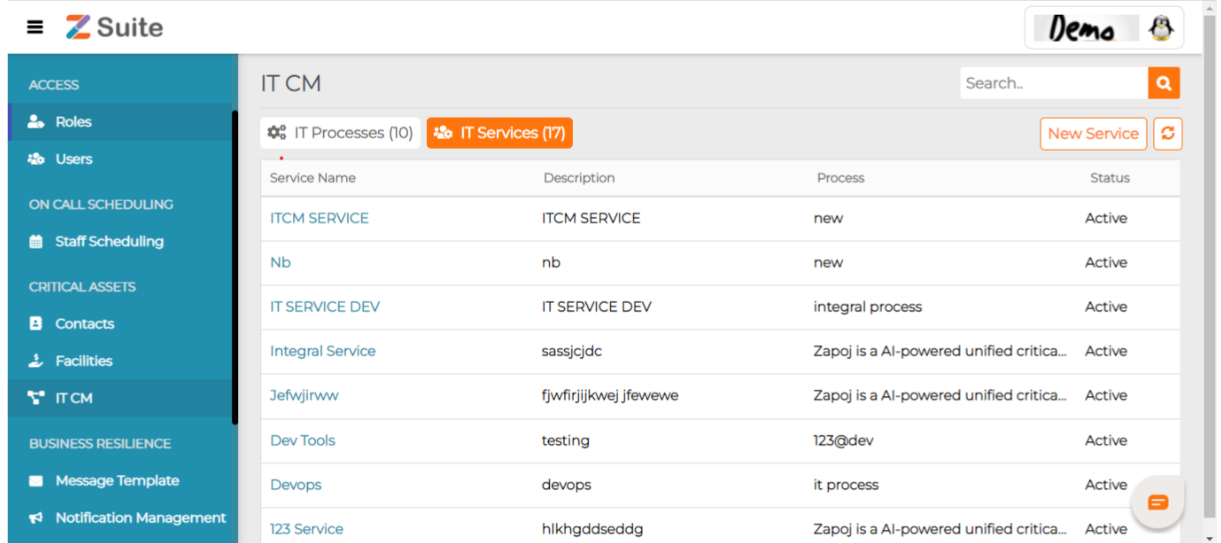
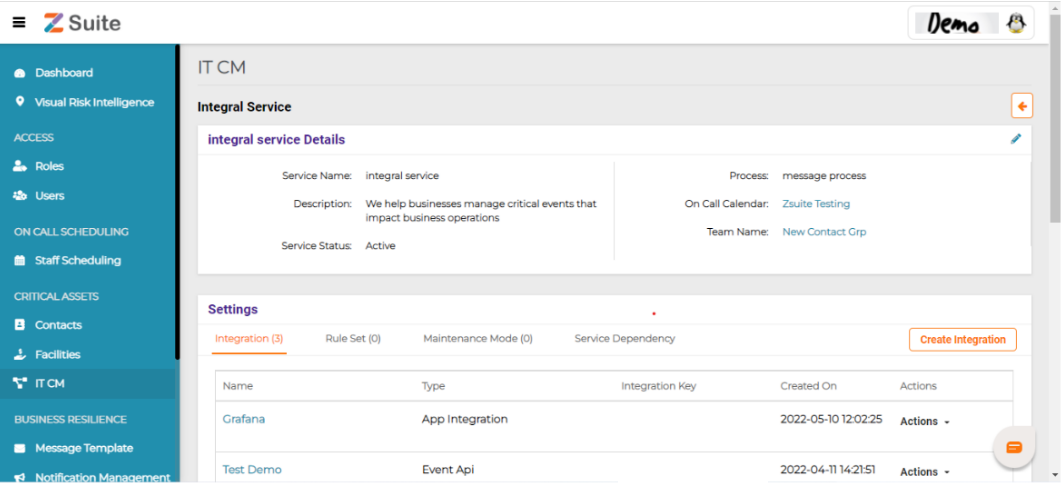
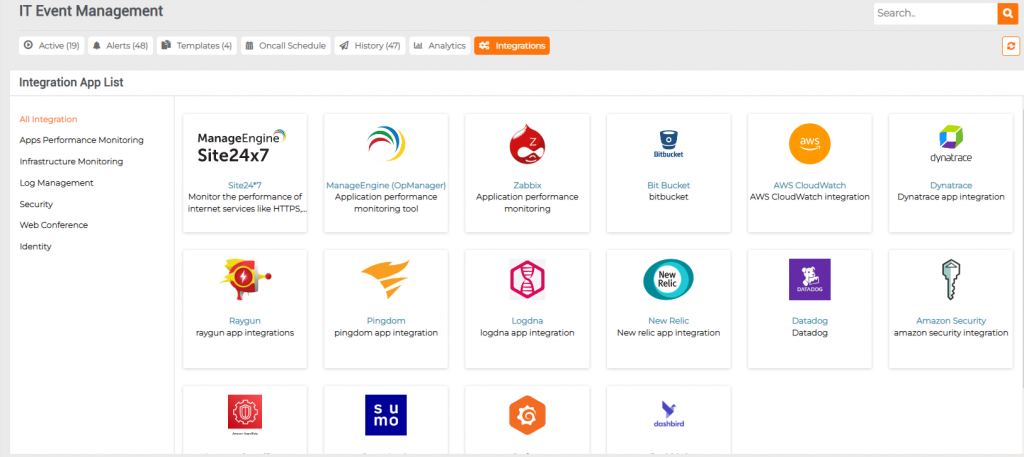
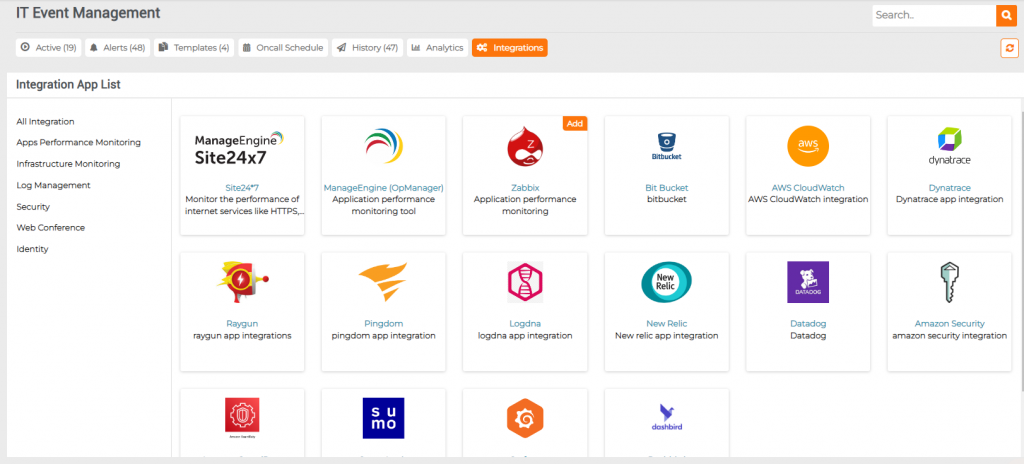
IT Event Integrations
IT Event integrations
Click on Integrations and user can find the details of Integrable App List.
Users can find integration means for Apps on Performance Monitoring, Infrastructure Monitoring, Log Management, Security, Web Conference and Identity.
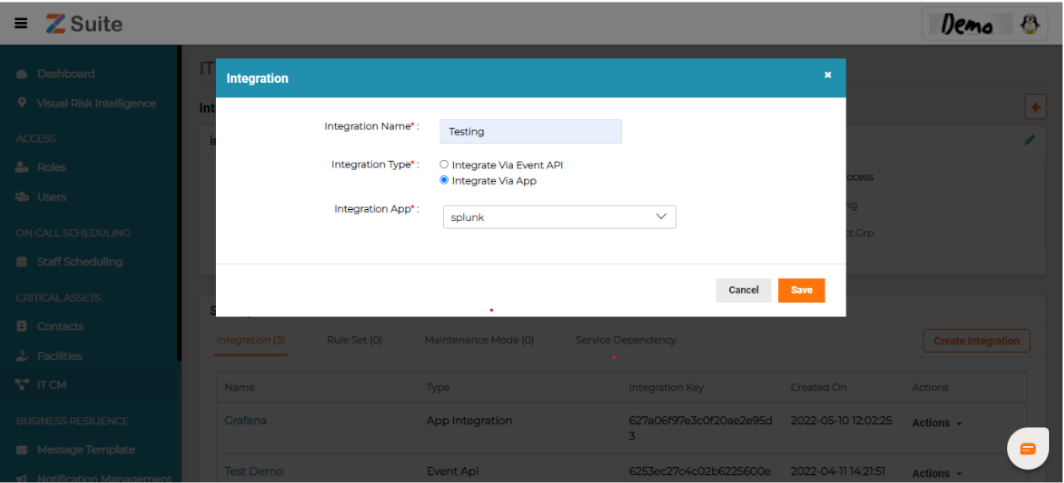
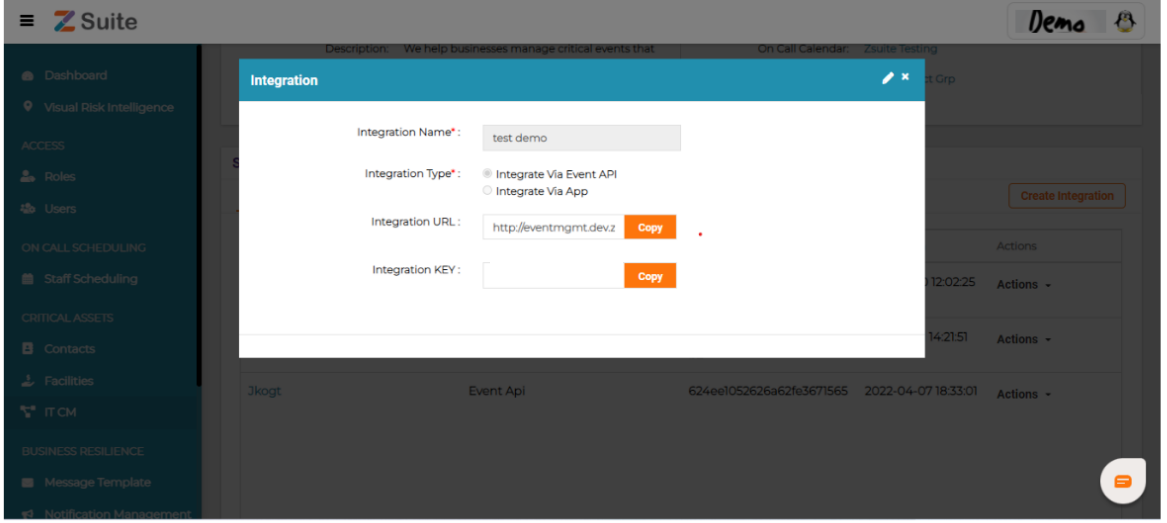
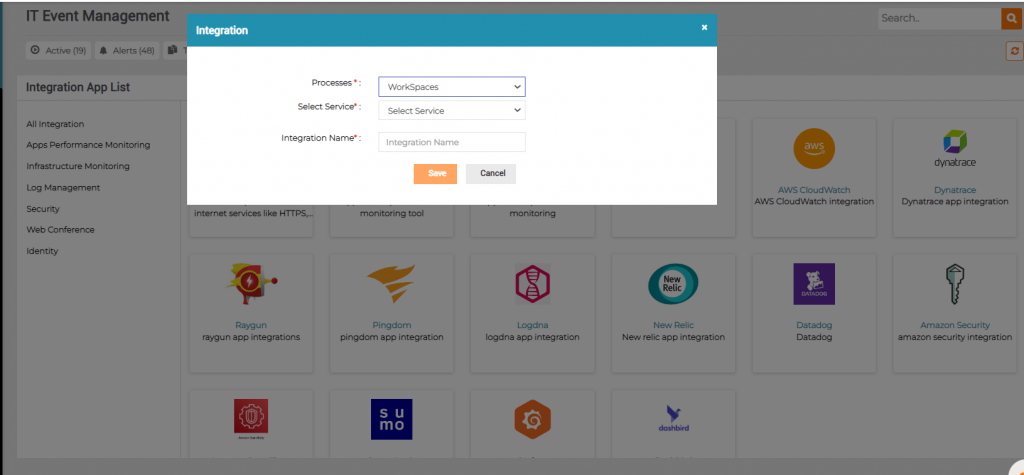
Add Integration
Click on Add to add integration
Users will be redirected to the Integrations page. Fill in the Process, Service and Integration name.
After filling Process, Service and Integration Name click on “Save”.
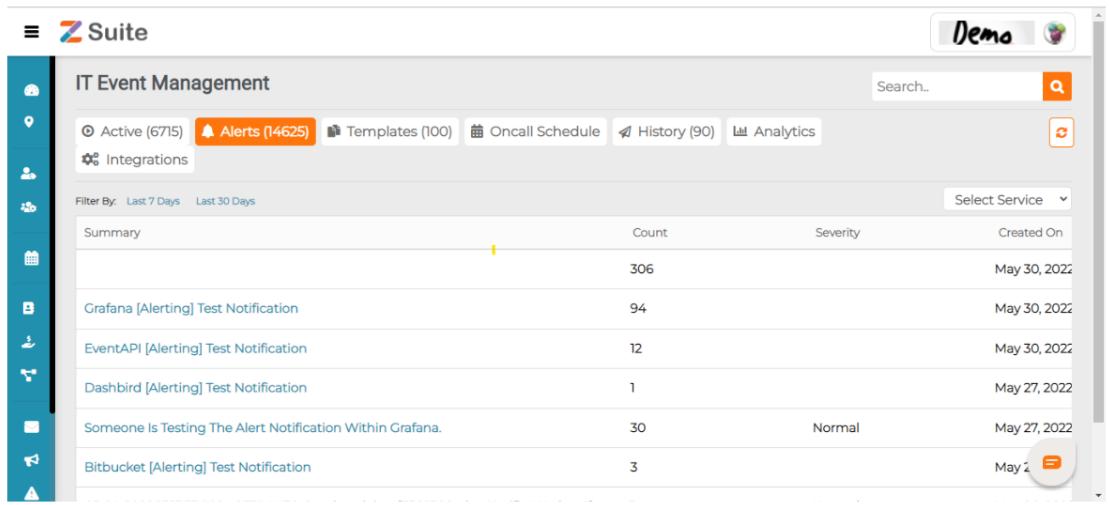
IT Event Alerts
IT Event Alerts
IT event alerts are urgent notification about the occurrence of an IT specific disruption or degradation that is sent to responsible stakeholders to initiate appropriate action.
IT Event alerts provide organizations the ability to accelerate on-call staff response to unplanned IT issues and restore services within their service level agreements. IT Alerting calendar and shift management keep staff on-call schedules up to date and automatically determine who is on-call (primary and backup), and who to escalate should that be needed.
Step by step process on “How to access active and history incidents” in Zsuite, Quick and Easy with this video.
IT Event Alerts consolidates, reduces the noise by eliminating duplicate alerts from monitoring tools and automate these alerts only to the respective incident responders or support team who are on shift or call.
This provides organization the ability to accelerate on-call staff response to unplanned IT issues and restore services within their service level agreements. IT Alerting calendar and shift management keep staff on-call schedules up to date and automatically determine who is on-call (primary and backup), and who to escalate should that be needed.
One click conferencing capability help support staff to quickly jump on to a team call with no need to memorize or manually dial numbers, key in access codes, and get directly connected to the conference from a Voice Message, SMS, Email from anywhere in the world.
Ensure responders, impacted users and stakeholders are well informed on the response and resolution process with seamless communication and collaboration across teams during an Incident.
Incident Managers can quickly access detailed Incident reports and audit trails to know instantly who was contacted, through which communication channel, who responded, and at what time.
Minimize Mean Time to Acknowledge (MTTA) and Mean Time to Resolve (MTTR).
IT Event Alerts:
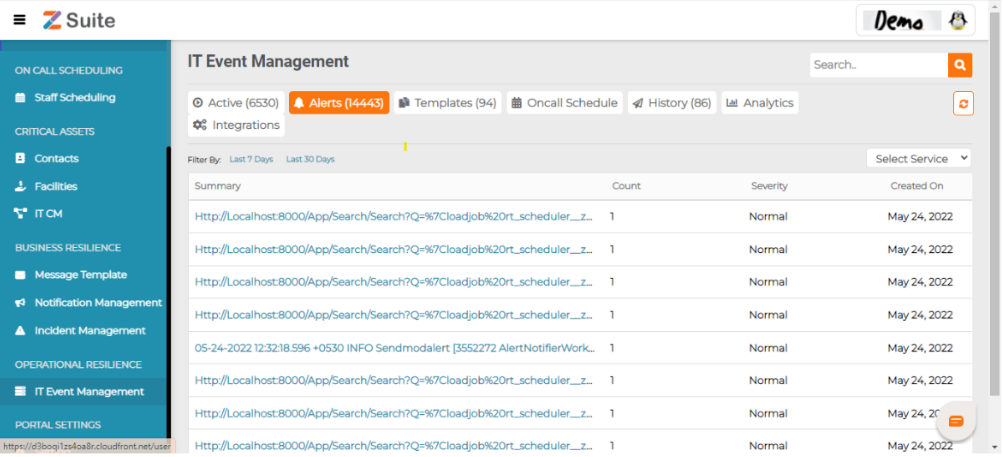
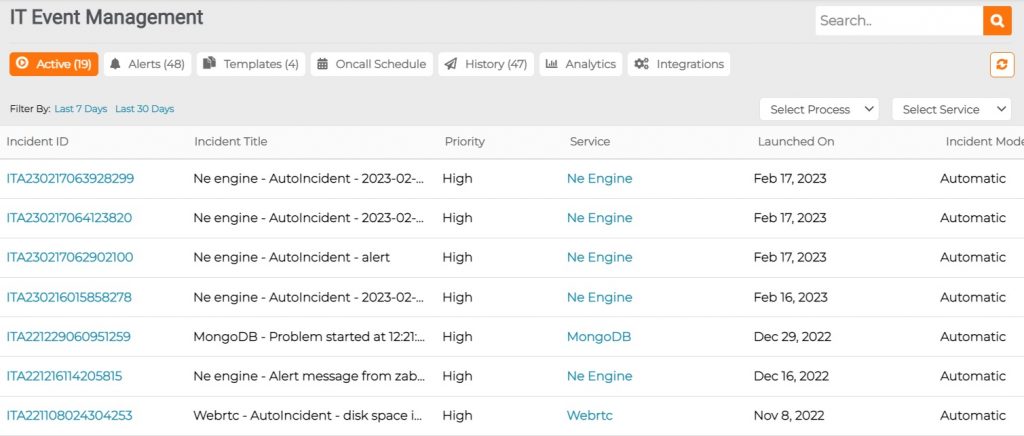
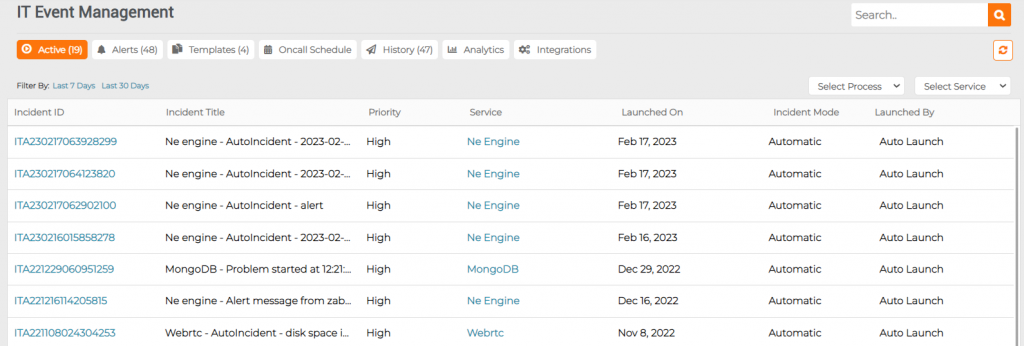
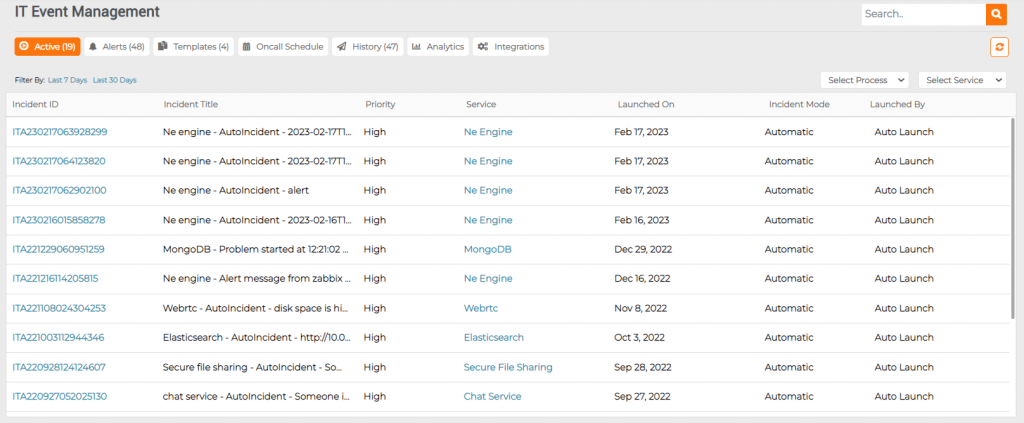
On clicking IT Event Management you can view the IT Incidents that are already created. Here users can view the respective IT Incident details like IT Incident ID, Incident Title, Priority, Service, Launched On and Incident Mode.
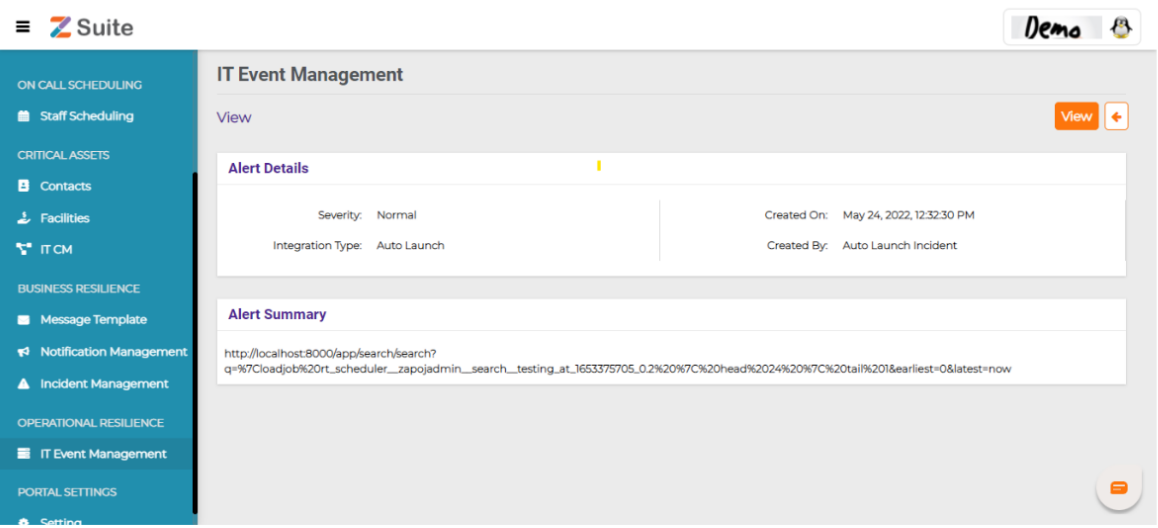
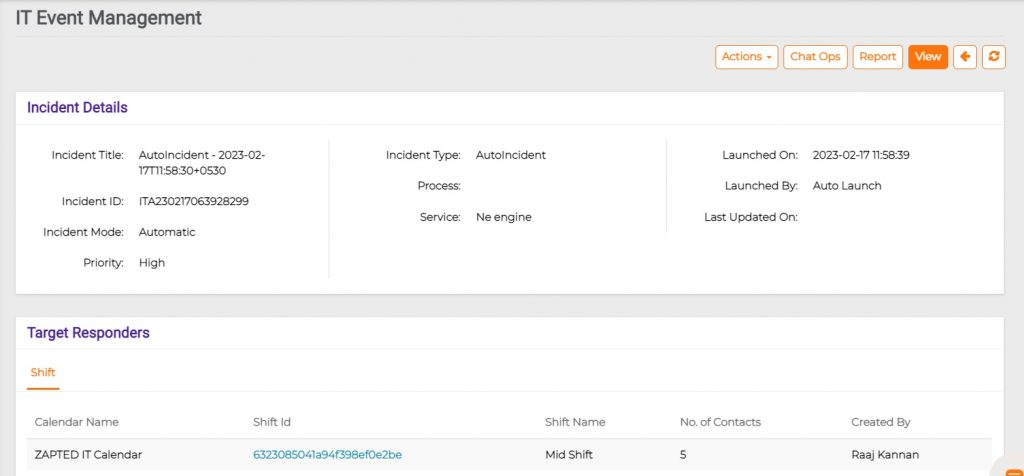
Viewing an IT Incident:
Click on the Incident Id to view the respective Incident details like Incident title, Incident type, Launched by, Launched date Incident ID, Process, Service, Launched By, Incident Mode, Last Updated Date and Priority.
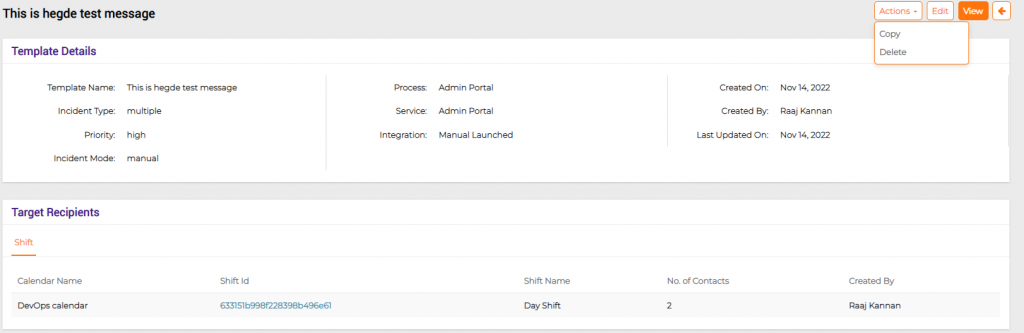
In Target Responders users can view the details of shifts like Calendar Name, Shift ID, Shift Name, Number of Contacts and Created By.
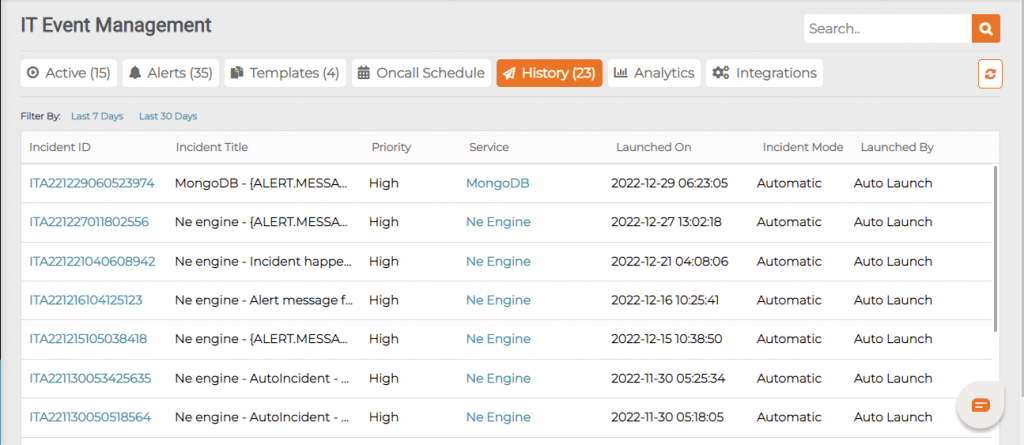
IT Event History: IT Event History means a set of data with all details of an incident, documenting the history of the incident from occurrence to resolution, including original report, investigation, conclusions, remediation, verification of completion of remediation, and assessment of the resilience of improvements achieved.
Here users can find all the previously launched IT Event Templates.
Click on the History to view the respective incident details like Incident ID, Incident Title, Piority, Service, Launched date Incident Mode and Launched By.
Who Can Access IT Event Management Features?
Who Can Access IT Event Management Features?
IT Event Manager: An IT Event Manager is the one who is authorized to identify, respond and manage events that can affect the IT service quality to minimize its impact on operations.
This role will have full access permissions on all entities belonging to IT Event Management .
IT Event Operator: An IT Event Operator is the one who is authorized to act and operate on IT incidents that can affect the IT service quality, disrupting or deterring the dependent business operations. They register IT incidents to assign the same to the appropriate support group.
IT operator can launch Existing Incident Templates or Create New IT Incidents or View Alerts or View Integration & Analytics .
IT Incident Responder: IT Incident Responder is the one who is responsible to fix the underlying issue with the Incident . IT responders will receive notification either as SMS or EMAIL or Voice CALL or Push Notifications. Each IT Responder must be first created as a Contact in Zsuite, so that Staff Scheduling and contact details for Incident related Notifications are available during Broadcast. In case, if the Organization is using Zapoj Workspaces , then contact will be generated as Workspace Member for Team Communications & Collaborations . Additionally IT responders will have access to Zsuite to monitor incoming Alerts , Metrics , Incident status etc .
IT Responder role users can only View Incident, Alerts, Analytics and Integration flows. IT Responders can add notes to Open Incidents.
IT StakeHolder: IT Stakeholders are the Business owners of Services or Processes, who want to be informed of various incidents and metrics belonging to their Service or Incidents. IT StakeHolders will get notifications based on their wish to receive it as part of the staff schedule. IT Stakeholders can be logged in as Zsuite user, this role will have View access on Operations, Analytics tabs only.
IT Event Analytics
IT Event Analytics
IT Incident analytics provides structured data to identify what happened during an outage, discover what parts of the system were involved, who attended and how the problem was handled, the root cause or why it happened, what can be done to prevent or minimize the risk of recurrence from what has been learnt.
Step by step process on “How to access IT event analytics” in Zsuite, Quick and Easy with this video.
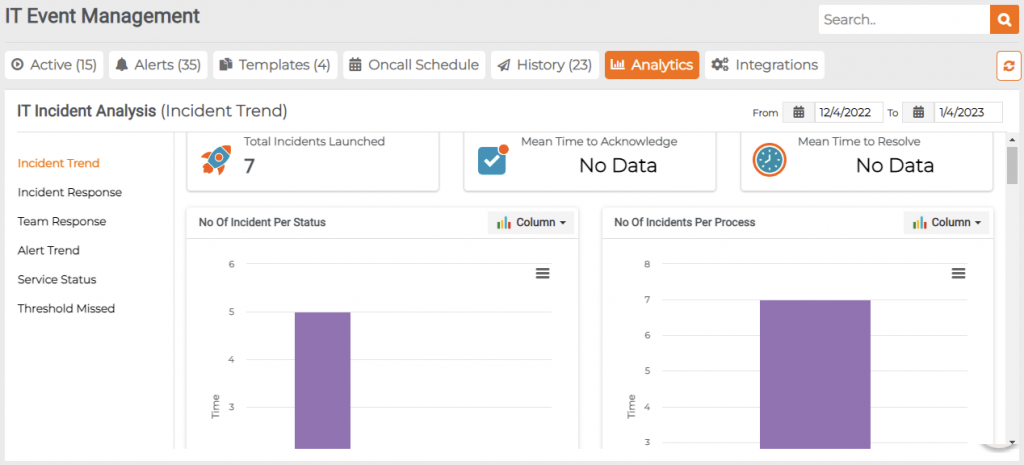
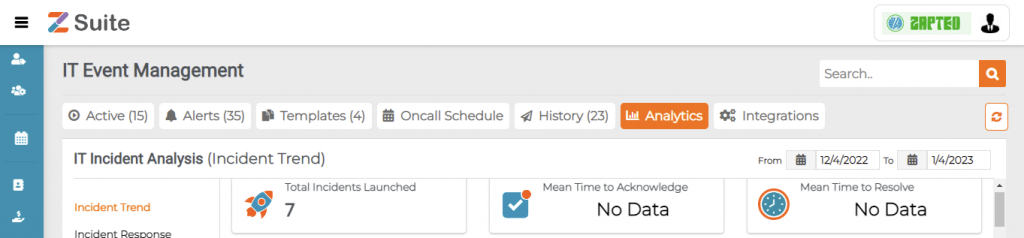
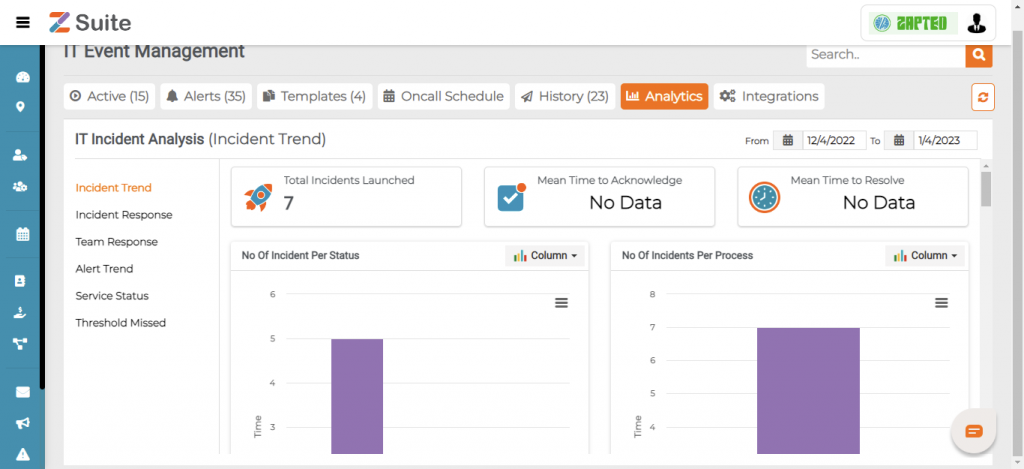
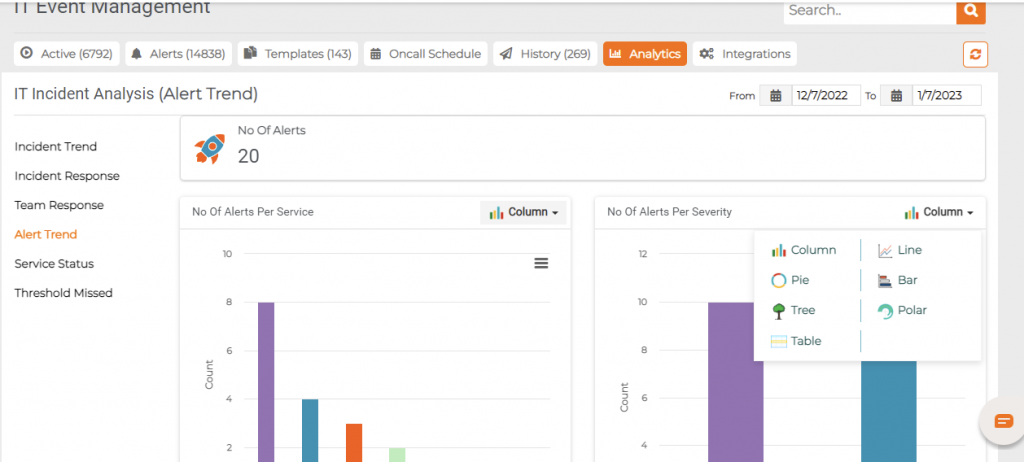
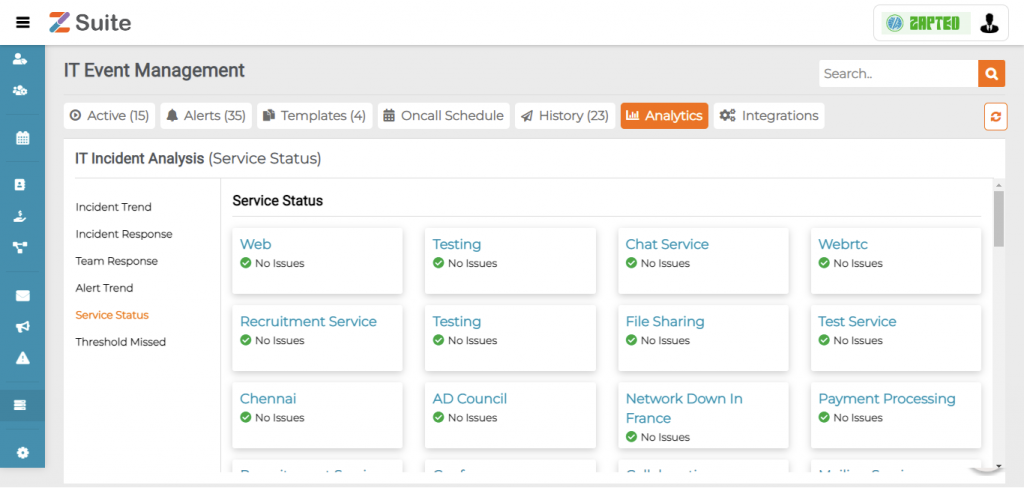
Click on IT Event Analytics to view the Details like Incident Trend, Incident Response, Team Response, Alert Trend, Process Close Times, Service Status and Threshold Missed.
Viewing a history:
Incident Trend: Click on Incident Trend Here are the Details you find for past incidents launched, Mean Time to Acknowledge, Mean Time to Resolve.
Mean Time to Acknowledge: Mean time to acknowledge is the average time taken from when an alert is triggered to when the work begins on the alert. This metric is useful for tracking alert system’s efficiency and the response team’s responsiveness.
MTTA is calculated by adding up the time between alert and acknowledgement, then dividing by the number of incidents.
For example: If you had 10 incidents and there was a total of 60 minutes of time between alert and acknowledgement for all 10, you divide 60 by 10 and come up with an average of 6 minutes.
Mean Time to Resolve: Mean time to resolve is the average time taken to fully resolve a incident. This includes the time spent detecting the incident, diagnosing, fixing and also ensuring that the incident would not recur again.
It is the difference between extinguishing a fire and fireproofing the vulnerable area post extinguishing.
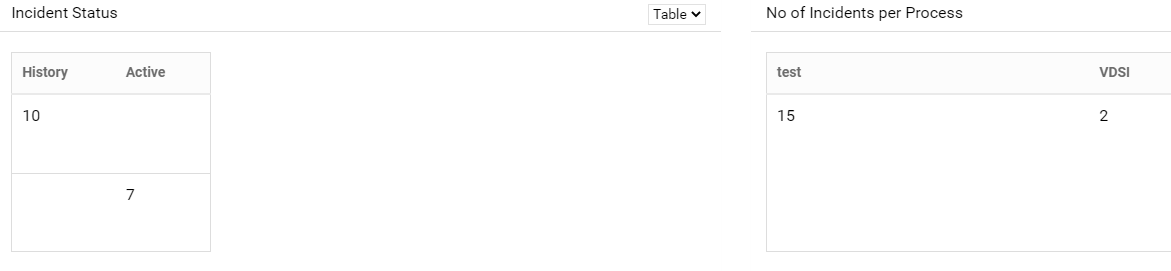
Incident Status & Number of Incidents per process view modes :
Here we have three types of modes are there like Table, Pie and Bar
In Table View Mode
In Bar view Mode :
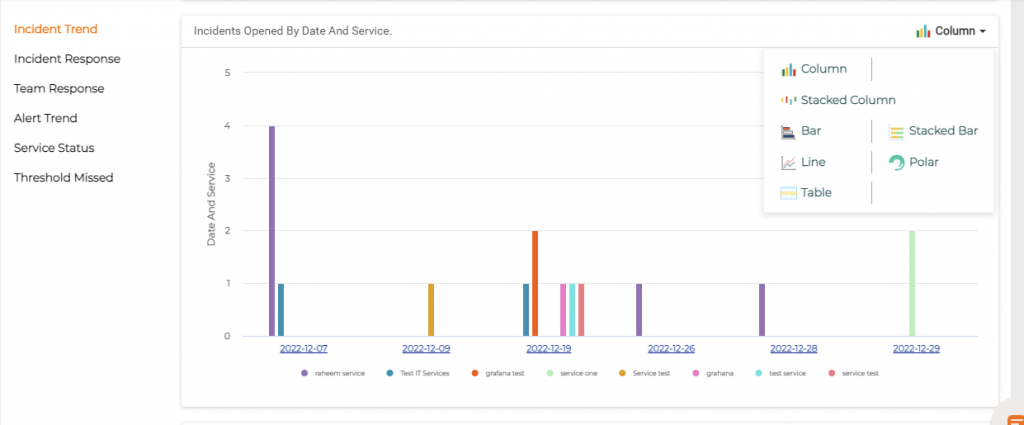
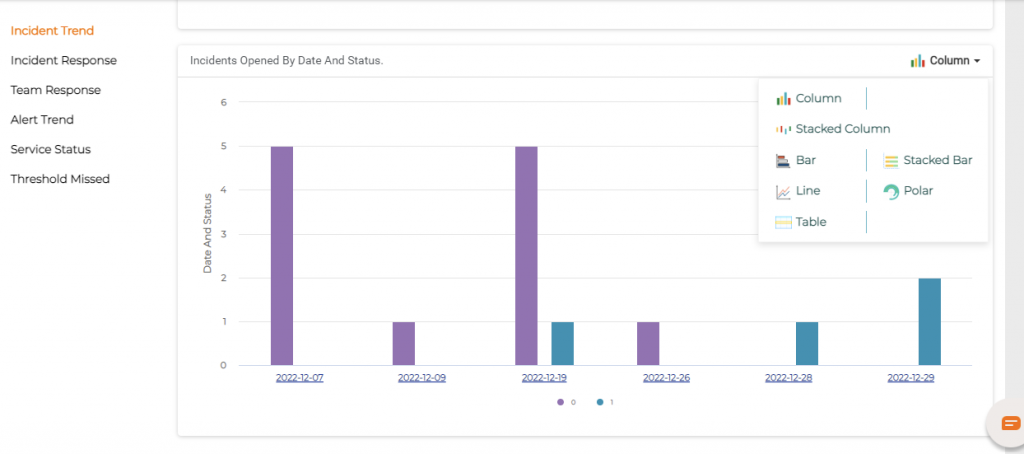
Incidents opened by Date and Service:
Incidents opened by Date and Status:
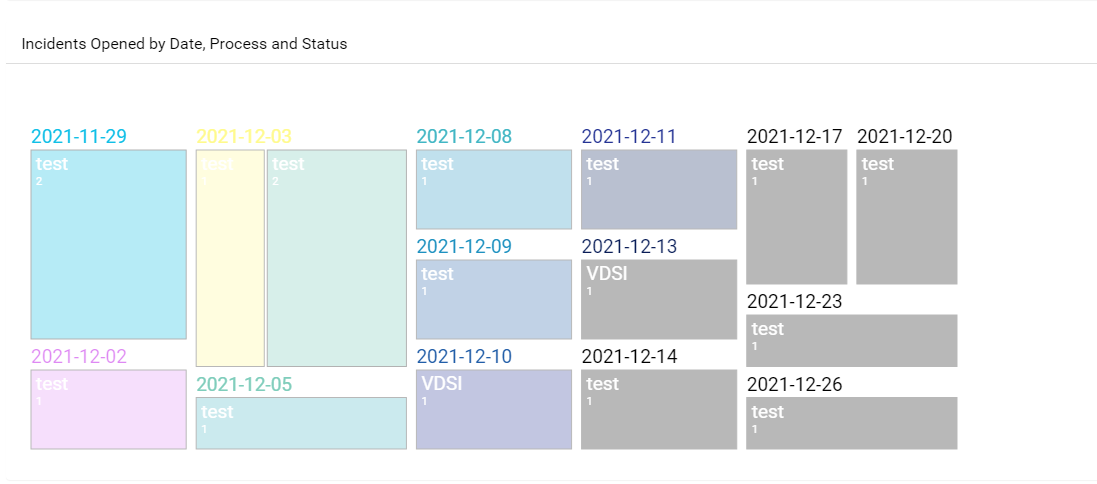
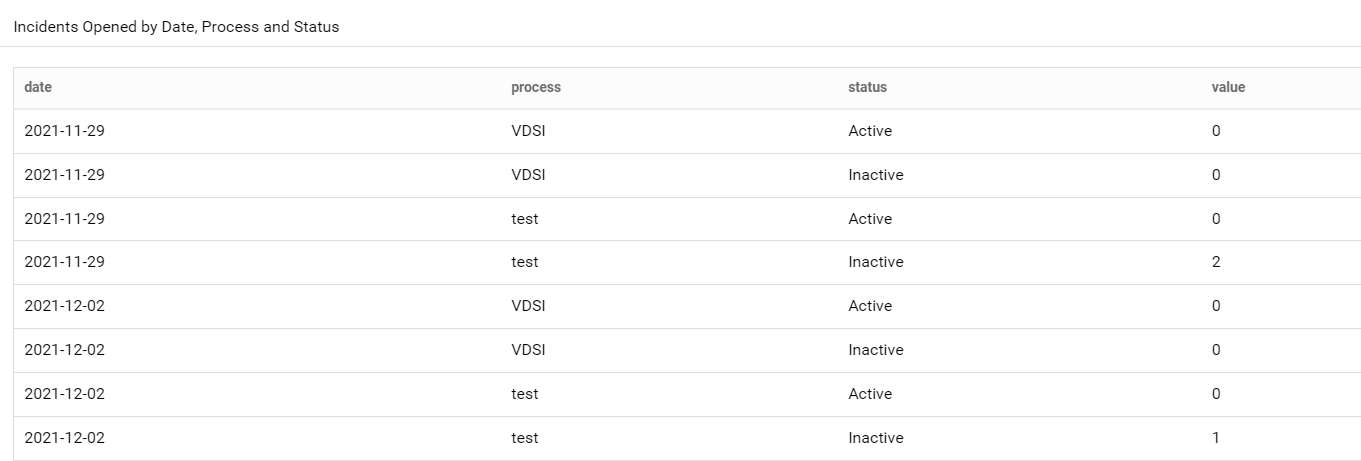
Incidents opened by Date, Process and Status
In Table view Mode
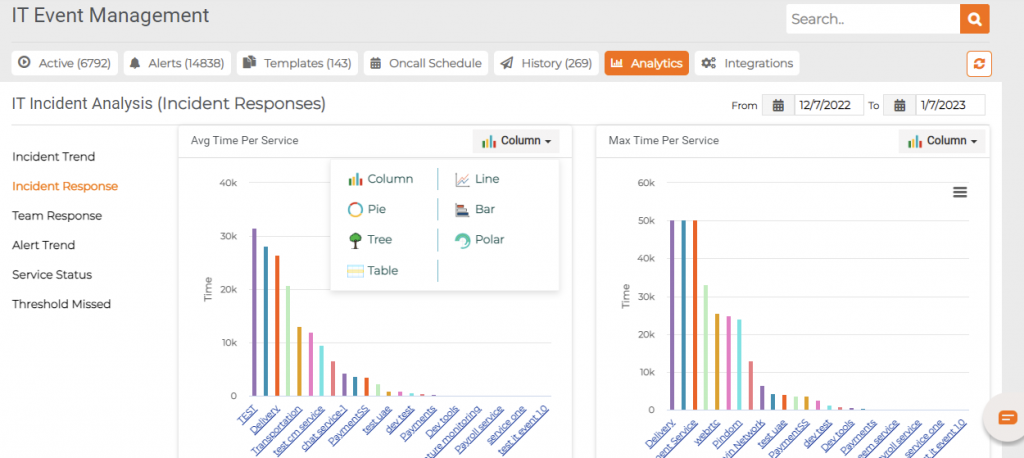
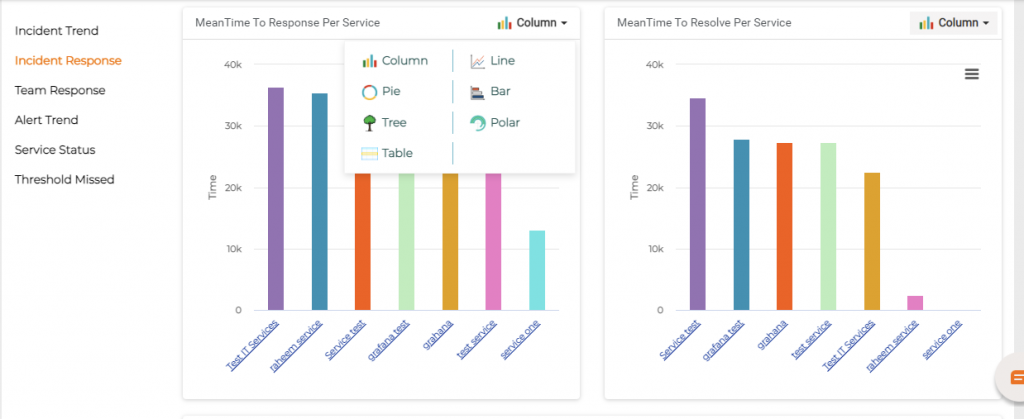
Incident response: Click on Incident Response and users can view the Average Time Per Service, Max Time Per Service.
Mean Time to Acknowledge Per Service and Mean Time to Resolve per Service
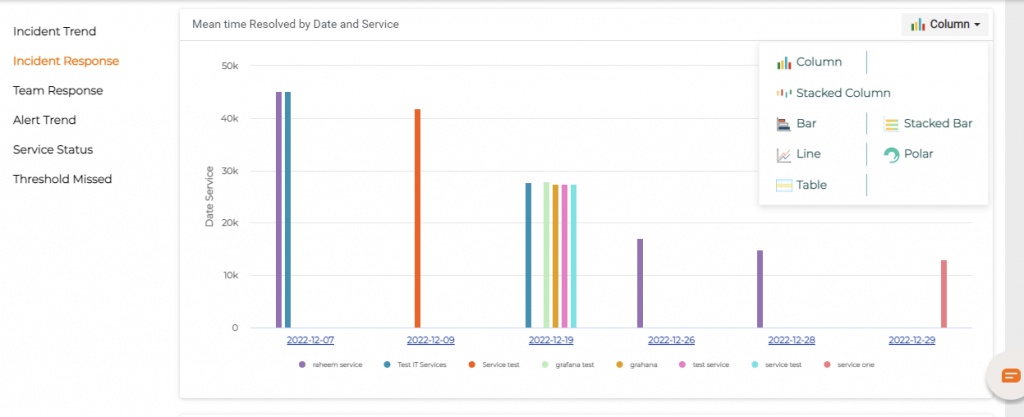
Mean Time Responded by Date, Service, and Priority
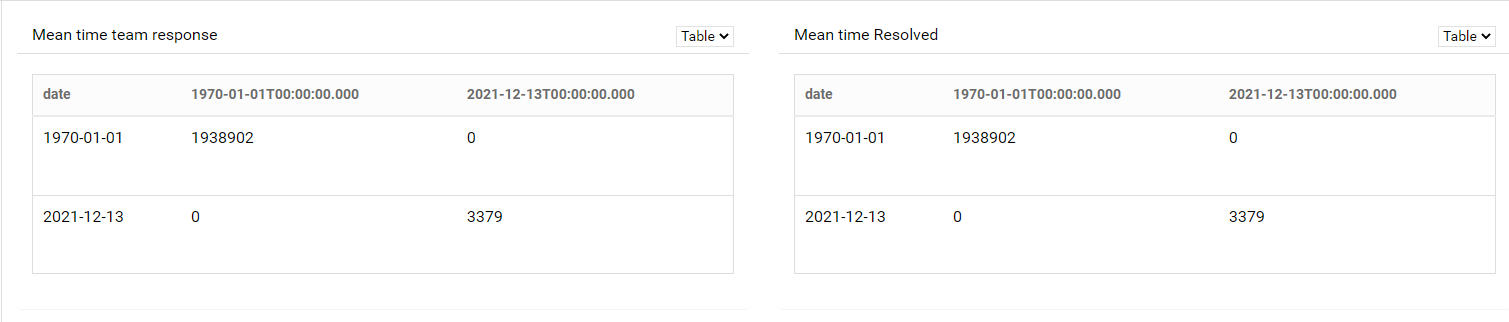
Team Response: Click on Team response to find the details like Mean Time team Response, Mean Time Resolved.
In Table view Mode
Mean Time Team Response and Mean Time-Resolved
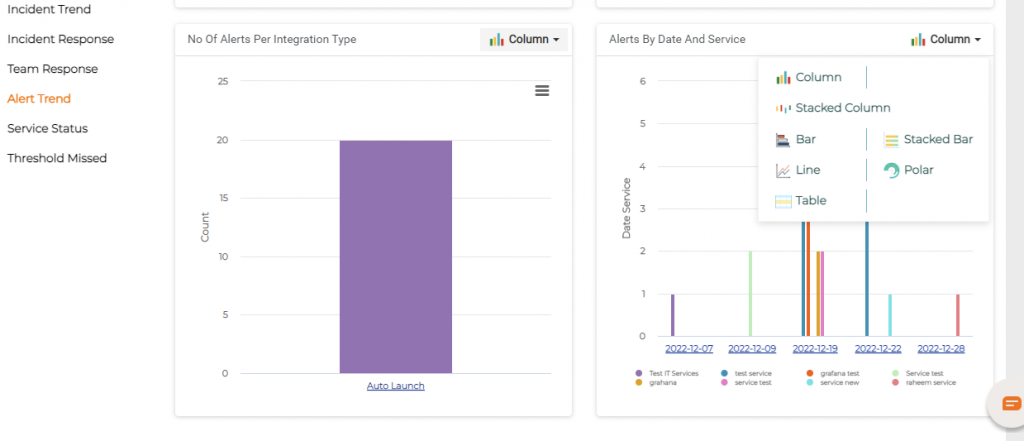
Alert Trend: Click on Alert Trend Response to find Details such as Number of Alerts Per Service, Alerts by Date, and Service.
Number of Alerts Per Integration Type and Number of Alerts Per Severity
Service Status: This shows the current operational status of the service like No Issues or Incidents.
IT Event Templates
IT Event Templates
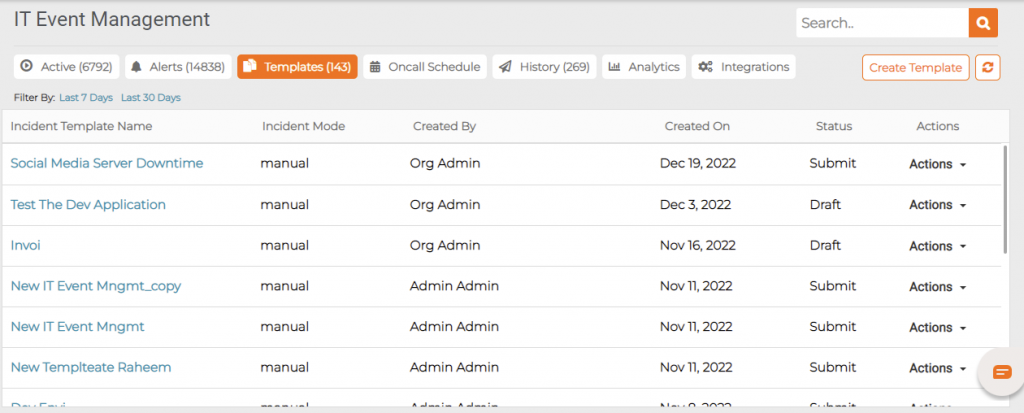
During IT Incidents to save time and simplify the user input process, pre defined IT incident templates can be used. These templates contain predefined data that populates when the template is applied to it, eliminating the need to manually re-enter this data.
Step by step process on “How to create and use IT incident templates” in Zsuite, Quick and Easy with this video.
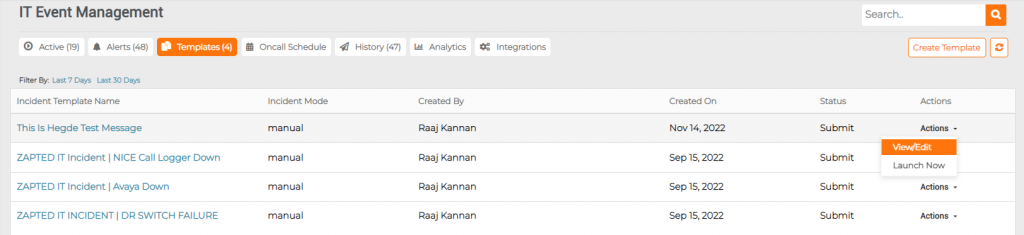
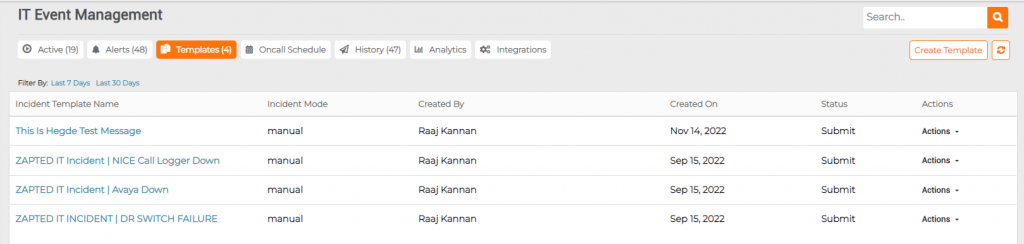
Click on templates to view the list of created templates.
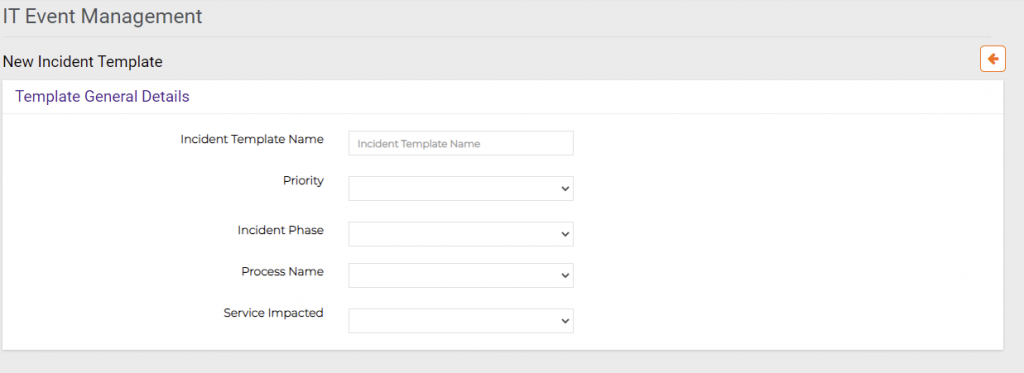
Creating a Template: To create a new template, click on the “Create Template” button given on the right top.
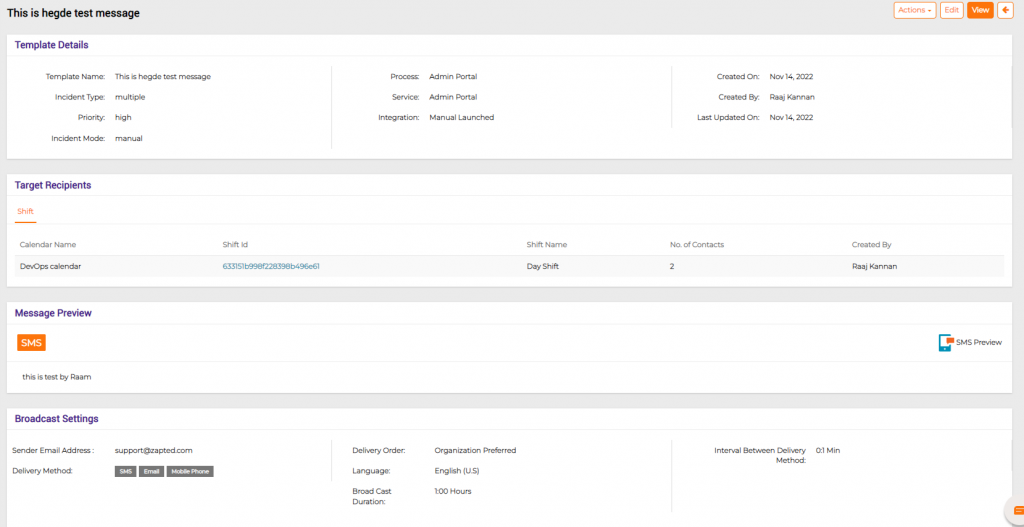
After clicking on the “Create Template” button you will be redirected to the page where you have to fill in some details like Template General Details, Fields, Messages, Responders and Settings.
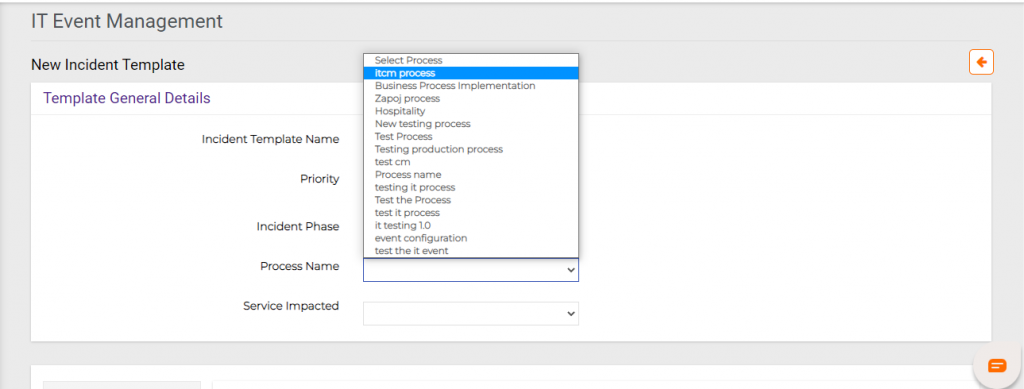
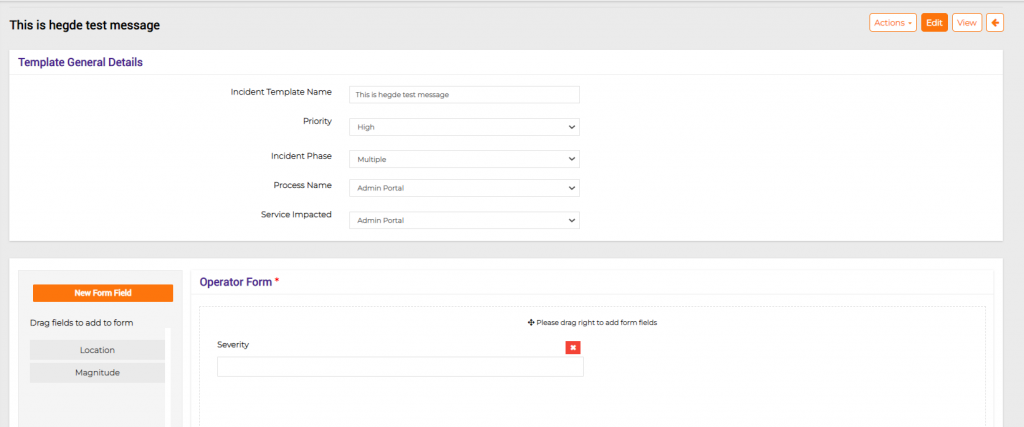
Template General Details:
New Incident Template Creation:
Incident Template Name: Enter the Incident Template Name.
Priority: Select Incident Priority from the dropdown list
Incident Phase:Select Single or Multi Phase from the dropdown list
Process Name: Select the impacted IT Process name from the dropdown list
Service Impacted: Select the impacted IT Service from the dropdown list
Form Operators: Drag and drop the Operator Form and users can also create Form Field by clicking on New Form Field.
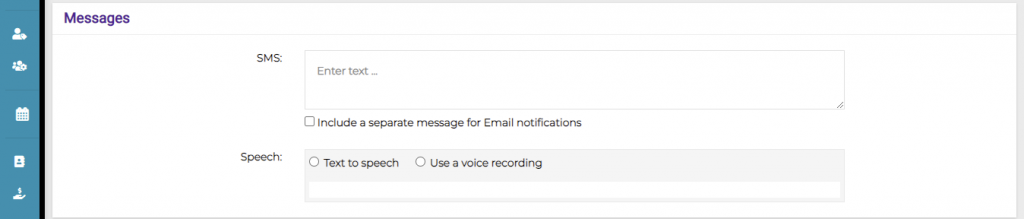
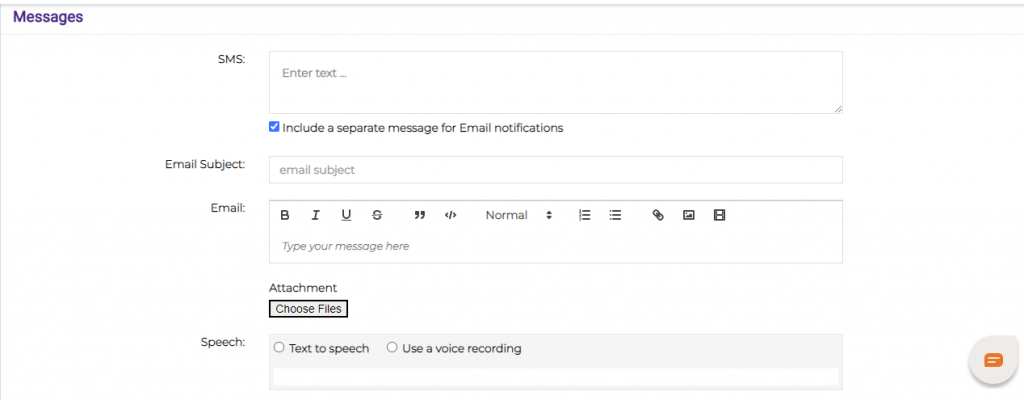
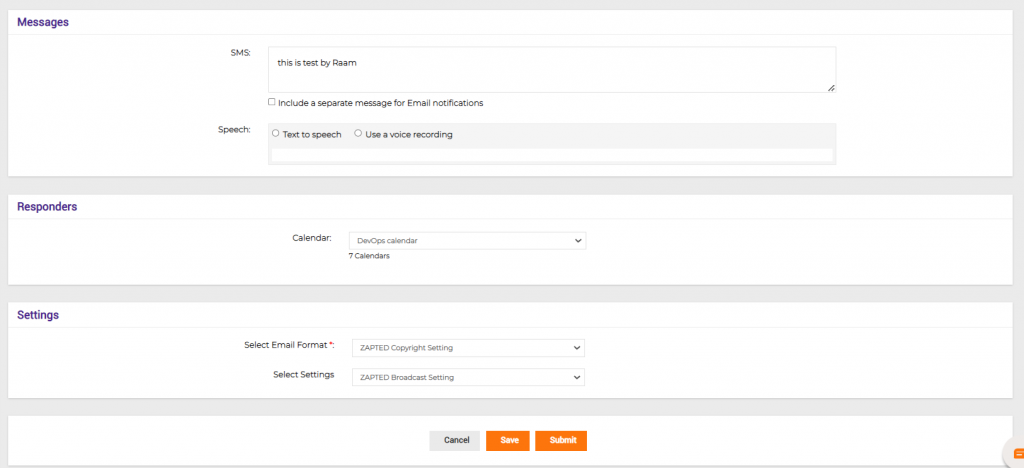
Messages: Enter the IT Incident Message in the Message box.
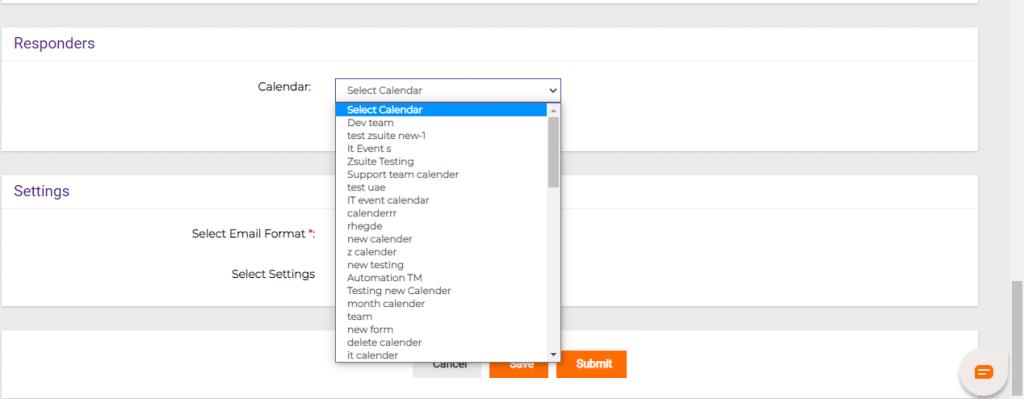
Responders: Select the IT shift calendar from the dropdown list to notify respective recipients.
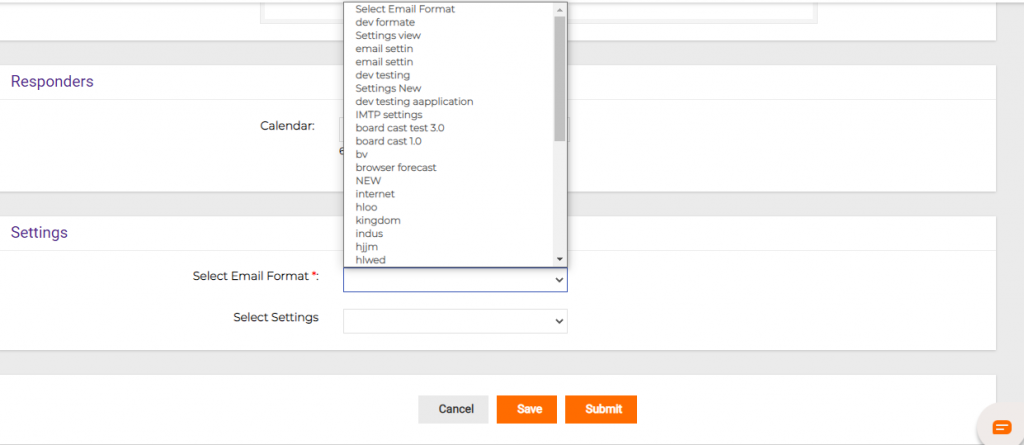
Settings: Select Email Settings and Format from the dropdown list.
Service Impacted:
Next, we have a Message option, where we can give the information which we wanted to share.
We will have the flexibility of adding up a separate message for Email Notification.
This is not mandatory but if we want to share a separate message then we can opt for this option.
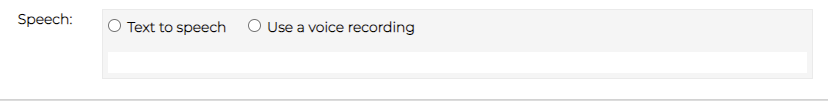
Next, we have an option of Text to Speech. Where we can convert text to audio, or we can also upload a voice recording.
Next, We have the option of selecting the responders, which we can select the respective responders based on their staff calendar from the dropdown.
Now we have to select the required Email Format and select the required Settings from their respective dropdowns and click on Save or Submit buttons for saving the new template.
View /Edit Template
Click on “Template Name” or click on “Actions “ dropdown and click on “View / Edit”.
The user will be redirected to the “ Template details” page.
The user can View / Edit the changes and click on “Submit”.
Delete Template
Click on the “Template Name”
The user will be redirected to the “Template details page”, click on “ Actions” and click on “Delete”.
Copy Template
Click on “Template Name”.
The user will be redirected to the “Template details page”, click on “ Actions” and click on “Copy”.
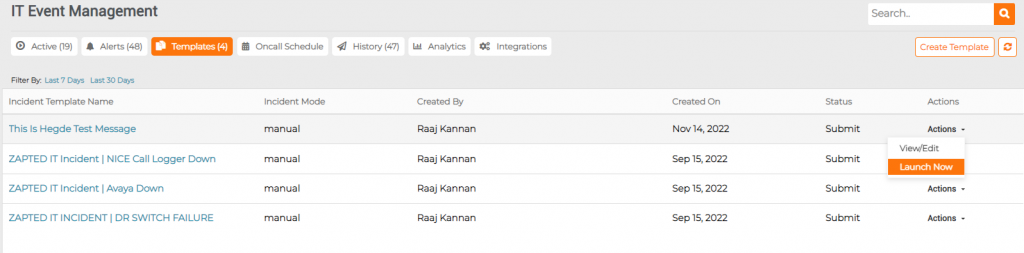
Launch Template
Click on the “Actions” dropdown and Click on “Launch Now” .
The user will be redirected to the Templates view.
Fill form field data, Alert Summary, select Timezone from the dropdown, and click on Launch. After Launching the Template, the template navigates to the Active tab.
IT Event Report
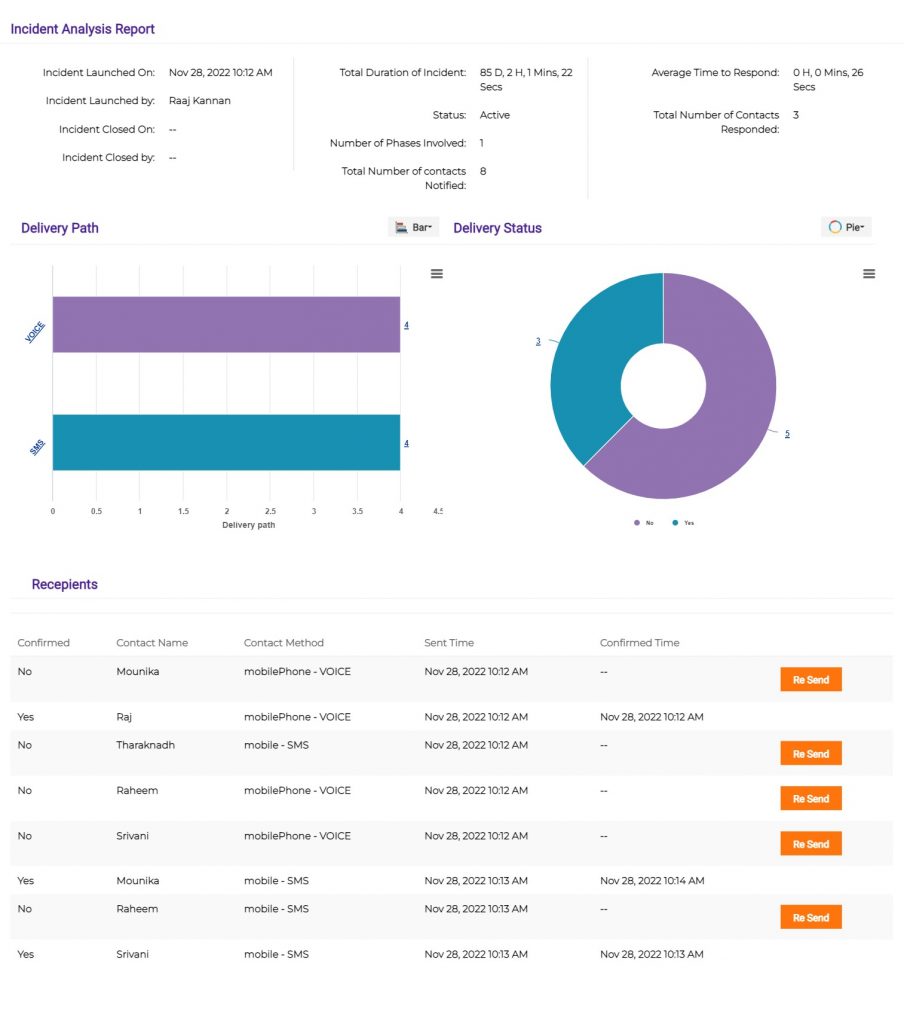
Click on the Incident ID. The user will be redirected to the Incident view. Click on the Reports, the user can find the Incident details and Contact details who received the notifications.
Here the user can see the complete report with Incident analysis that include details like Incident Launched On Date and Time, Total Duration of Incident, Average Time to Respond, Incident Launched By, Status, Total Number of Contacts Responded, Incident Closed On, Number of Phases Involved, Incident Closed By, Total Number of Contacts Notified and Delivery paths.
Recipients details such as Confirmed, Contact Name, Contact Method, Sent Time, Confirmed Time. Report is segmented into multiple sections. Every section show the respective details such as details related to incident creation, launching date and time.
Click on Reports and click Export As to view the Report data as an Image of PNG, JPEG, and PDF.
Close Template
Click on the Incident ID.
Users will be redirected to the Incident view page and click on “Actions” dropdown and click on “Close”.
IT EVENT MANAGEMENT ALERTS
IT Event Alerts
Provides organizations with the ability to accelerate on-call staff response to unplanned IT issues and restore services within their service level agreements. IT Alerting calendar and shift management keep staff on-call schedules up to date and automatically determine who’s on-call (primary and backup), and who to escalate should that be needed.
‘1-click’ conferencing capability means people can quickly jump on a team call. No number to memorize or dial, no access code to enter; get automatically connected to the conference from a voice message, a SMS or an email from anywhere in the world. Incident managers can also easily decline callers or mute participants.
Quickly access detailed reports and audit trails. Know instantly who was contacted, via which communication channel, as well as who responded, and at what time.
Keep stakeholders and impacted users informed during the resolution process
Reduce Noise of alerts coming from Monitoring tools.
Deduplicate all alerts from monitoring tools. Analytics on Type of Alerts and incidents.
Highly Customizable to meet business needs
Improves Mean Time to Resolve.
Ensure Communication & Collaborative Workspaces for Response Teams during Incident.
Alert only staff who are on duty or on call.
Brings responders, stakeholders on to common page
Incident and communication tracking for Compliance needs.
IT Event Alerts:
IT Event History: Here you will find all the previous Templates. Every detail you see in the Template will be seen here also.
pilihan bermain game online paling banyak digemari masyarakat indonesia dengan permainan game slot online terbaik saat ini adalah mengunjungi link https://fokusparlemen.id/ daftar sekarang juga dan dapatkan kemenangan bermain slot gacor hari ini dengan minimum deposit 10K