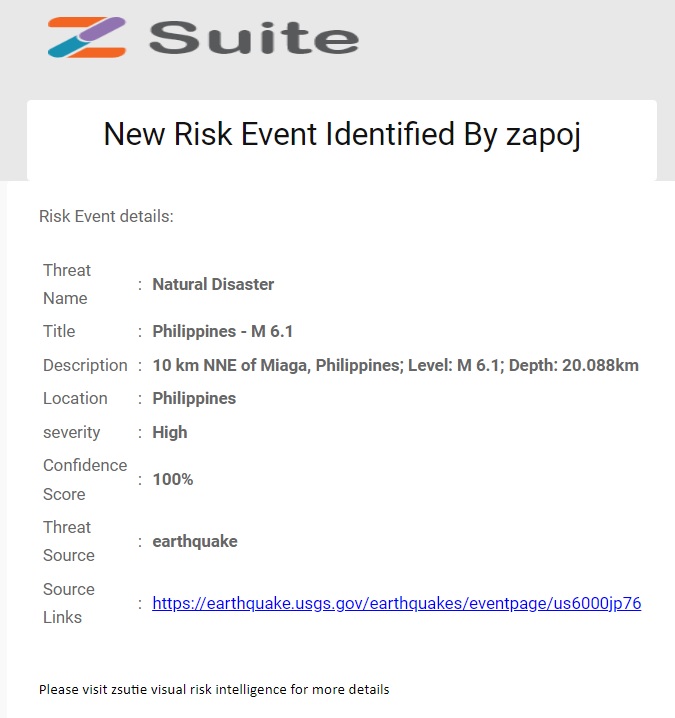
Threat alert notifications inform stakeholders on the critical threats or incidents that could impact when they happen at the same city / location of organizational contacts or assets.
High Severity Alerts are automatically triggered to the respective Email IDs of the Contacts who are assigned in the Organization Admin and Security Analyst Roles.
The alert email will contain the Threat Event details like Threat Name, Title, Description, Location, Severity, Confidence Score, Threat Source and Source Links panen99.
Assets / Threats / Risks
Assets / Threats / Risks
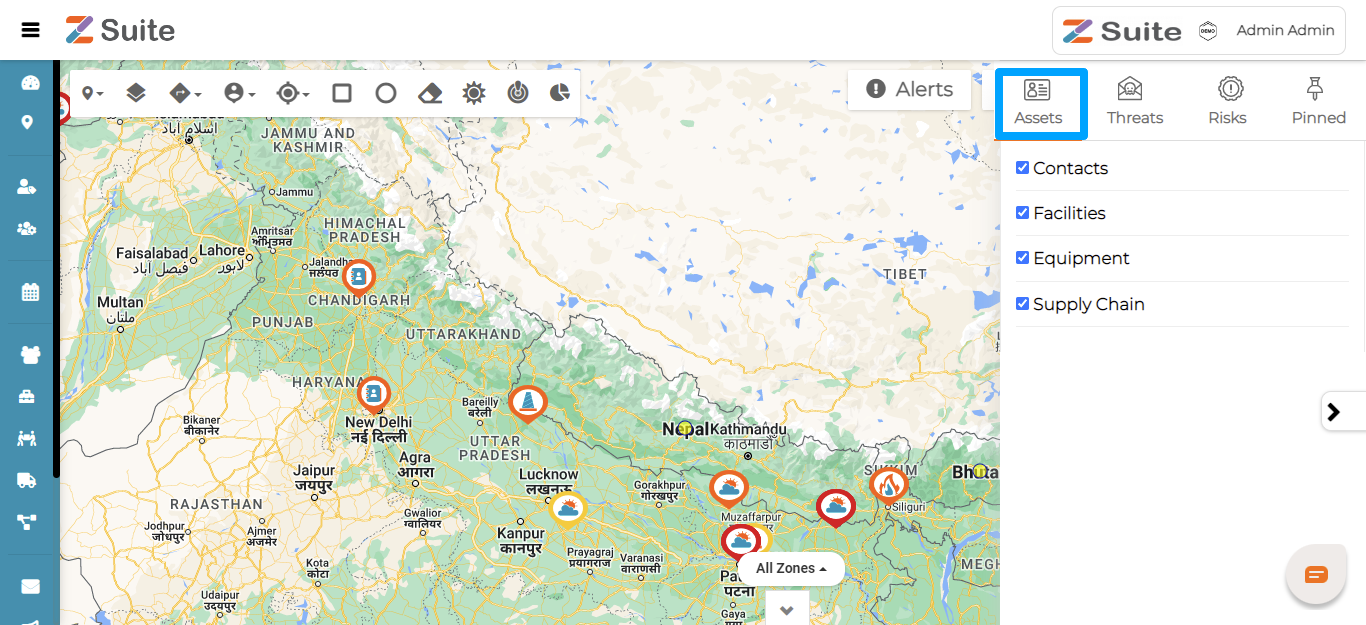
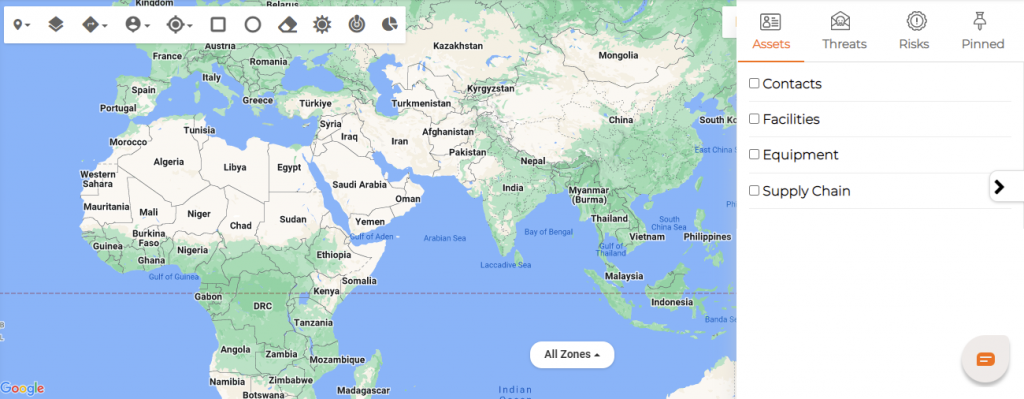
Assets: Click on the required Assets checkboxes Contacts / Facilities / Equipment / Supply Chain.
Step by step process on “How to filter assets in VRI” in Zsuite, Quick and Easy with this video.
Contact: Contact is a person who receives critical, emergency, or non-emergency messages launched from the Zsuite application. A contact can be Employee, Customer, Vendor, Supplier, or Student.
Facilities: Facilities are premises like office buildings, schools, hospitals, hotels, laboratories, government institutions, etc., that hosts people, systems, data, etc.,
Equipment: Equipment means all kind of machines or apparatus or appliances such as mechanical, electrical, electronic fabrication used for the operations or maintenance.
Supply chain: A supply chain encompasses everything from the delivery of source materials from the supplier to the manufacturer through to its eventual delivery to the end user.
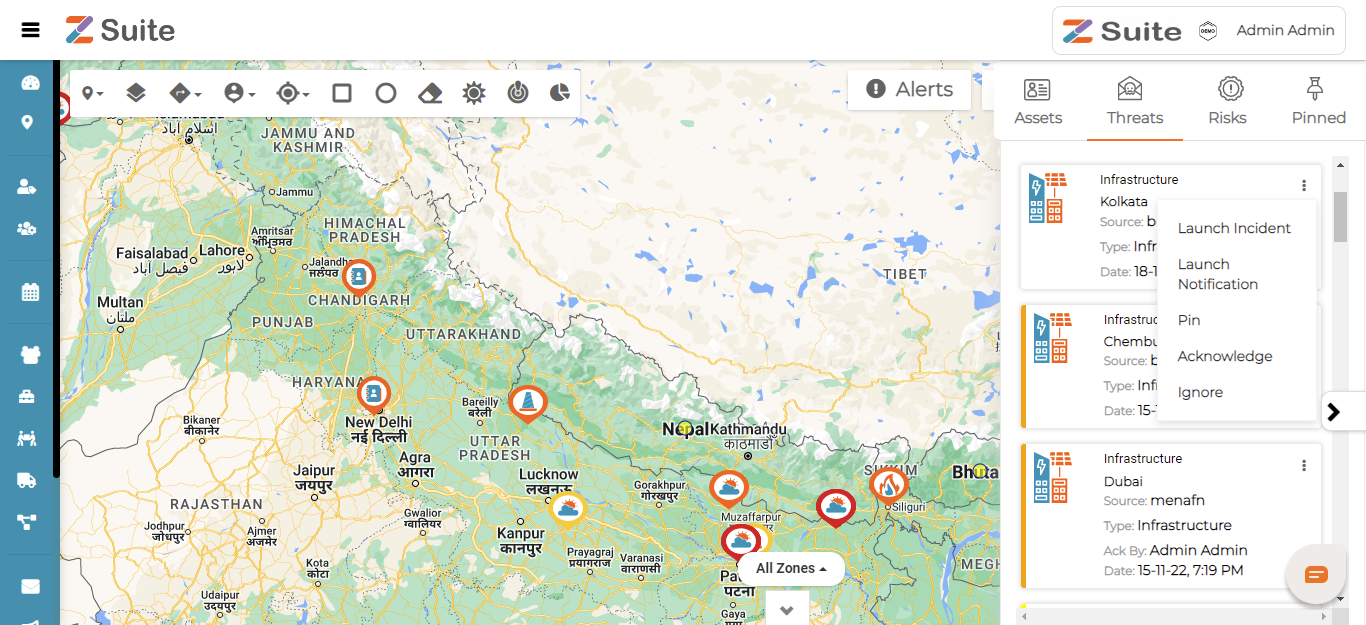
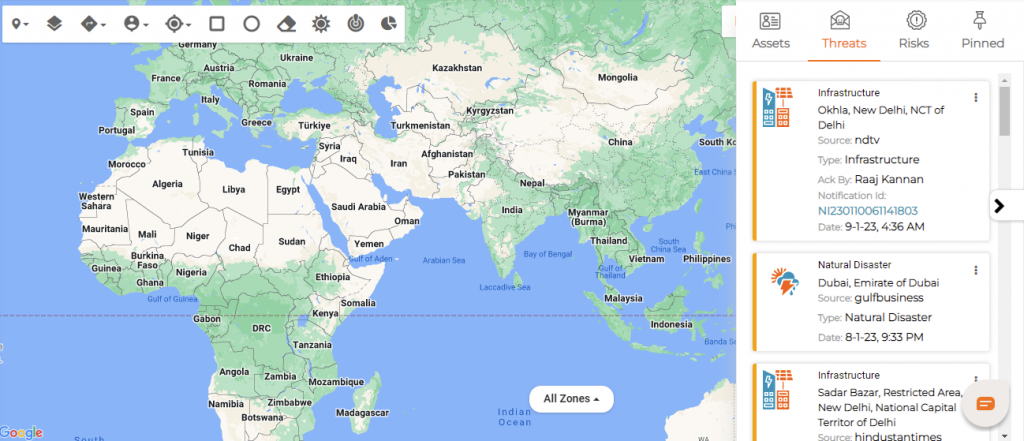
Threats: A threat, event, incident, or vector that may damage, impair, reduce, or adversely affect an asset or interest.
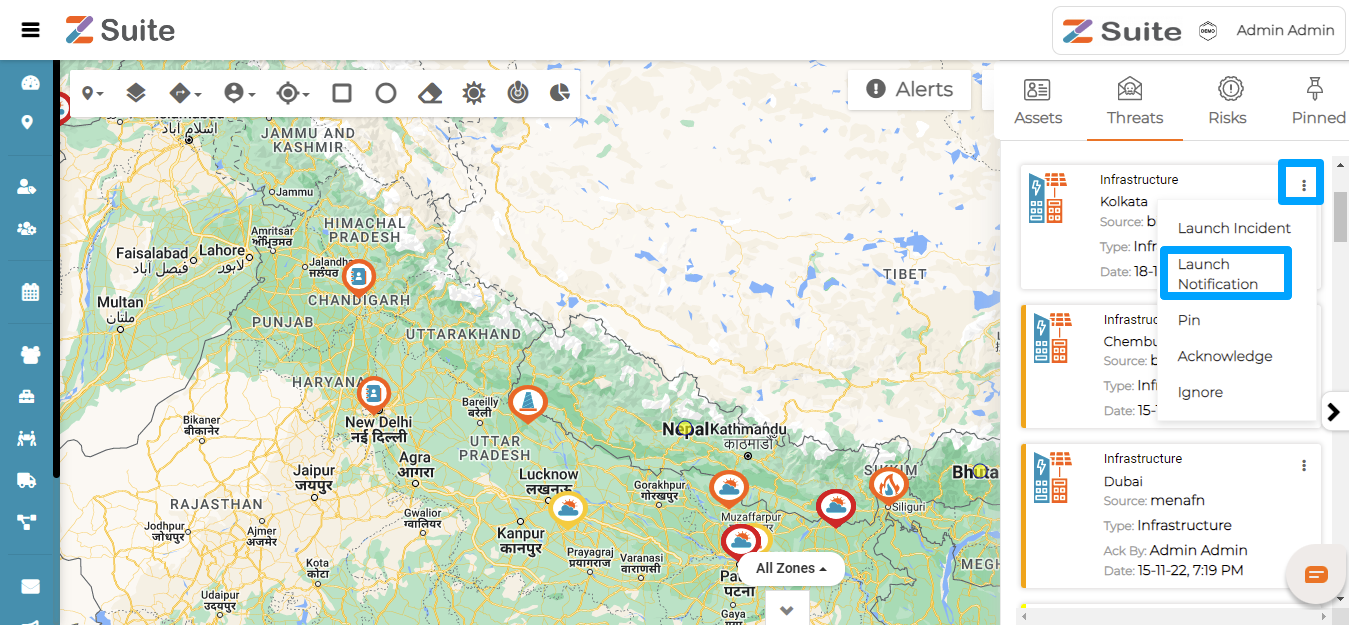
Click on Threats to check Threats around any of the created Assets. Clicking on more options, User can Launch Incident, Launch Notification, Pin for future reference, Acknowledge.
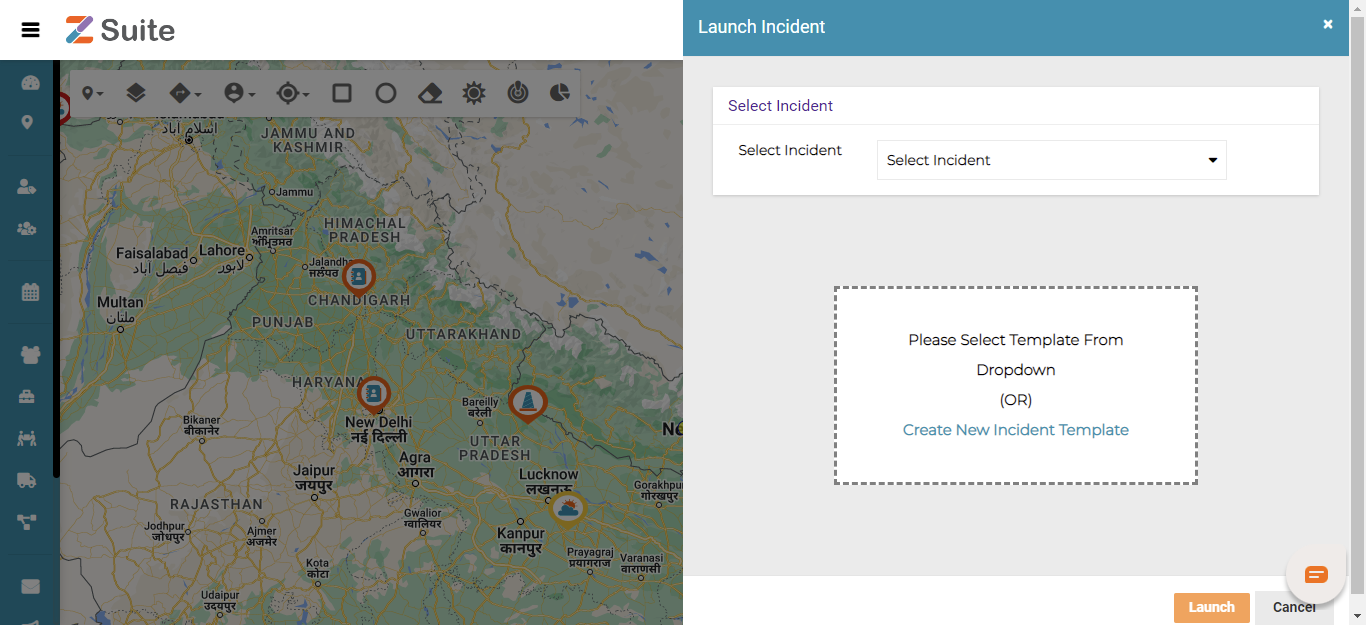
Launch Incident: An incident is occurrence due to unforeseen circumstances, which, if not handled duly, can turn severe to disrupt or deteriorate organization’s assets and services. Example: Personnel Absence, Power Outage, Network Failure, Transport Disruption.
If the threat is snowballing into an incident, user can Click on Launch Incident, User can select incidents in the dropdown and the user can also create a new incident template by clicking on Create New Incident Template.
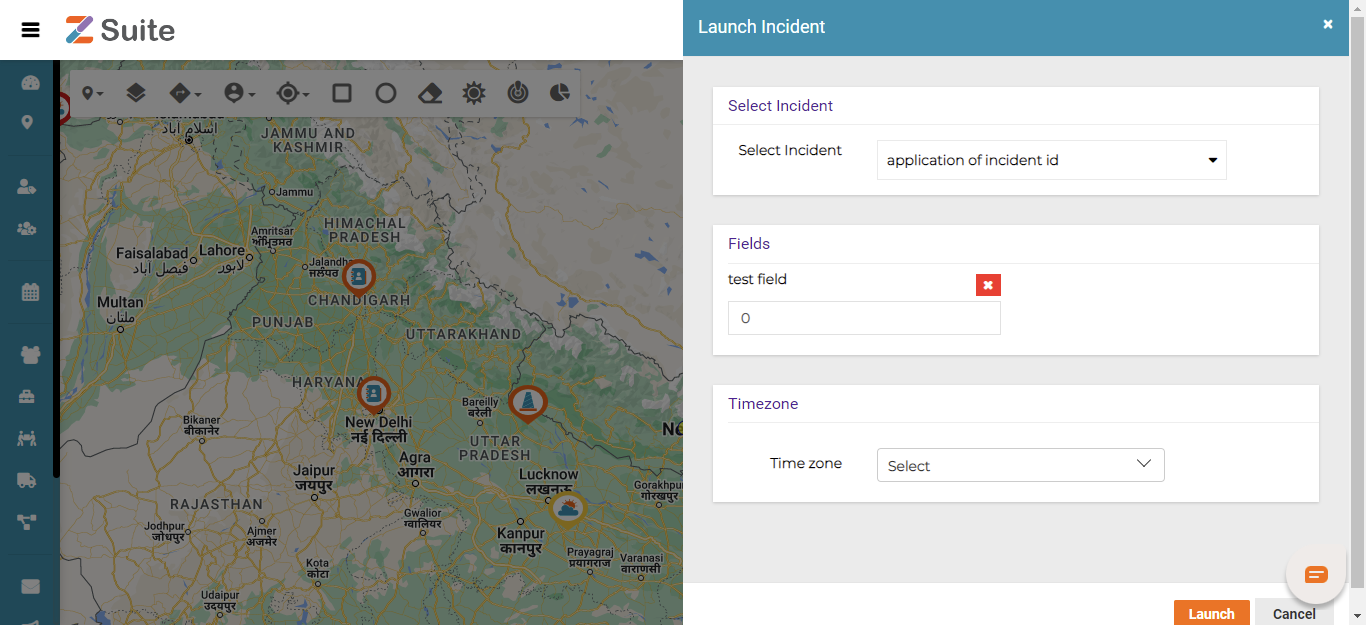
Select Incident from the dropdown and fill in the details of Fields and Timezone and click on the “Launch “button.
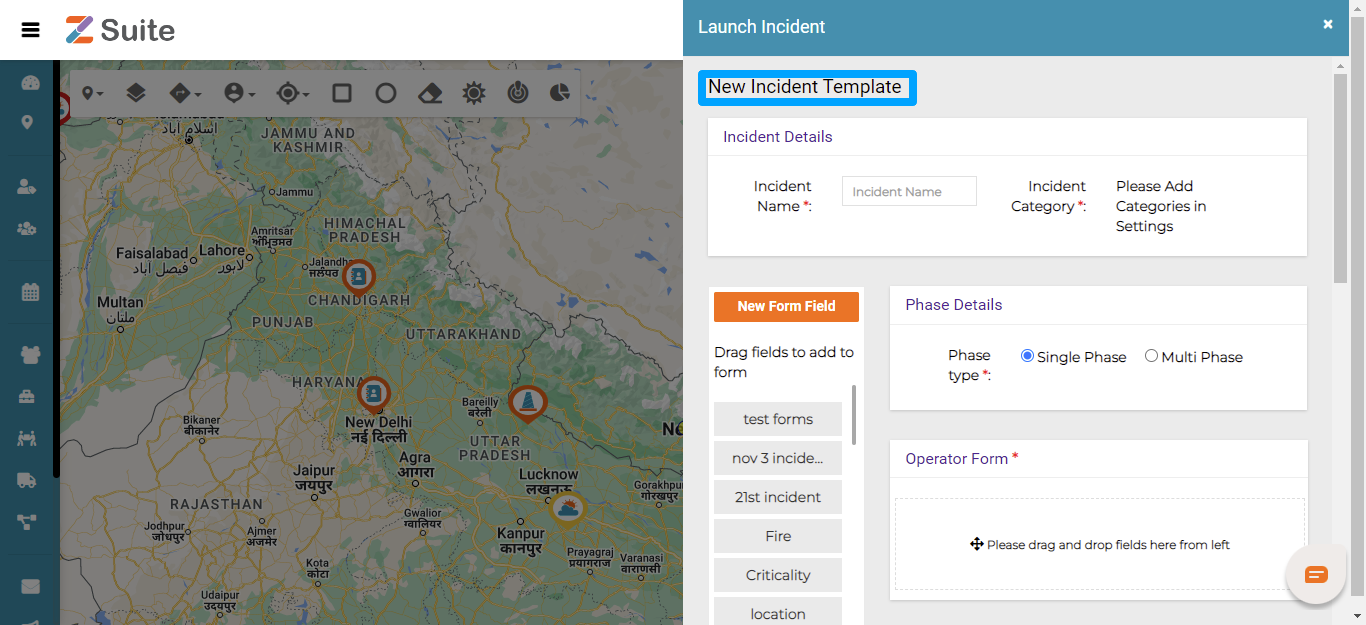
Click on Create New Incident Template to create a New Incident and then click on the “Submit” button. Any newly created Templates to be Approved for launch.
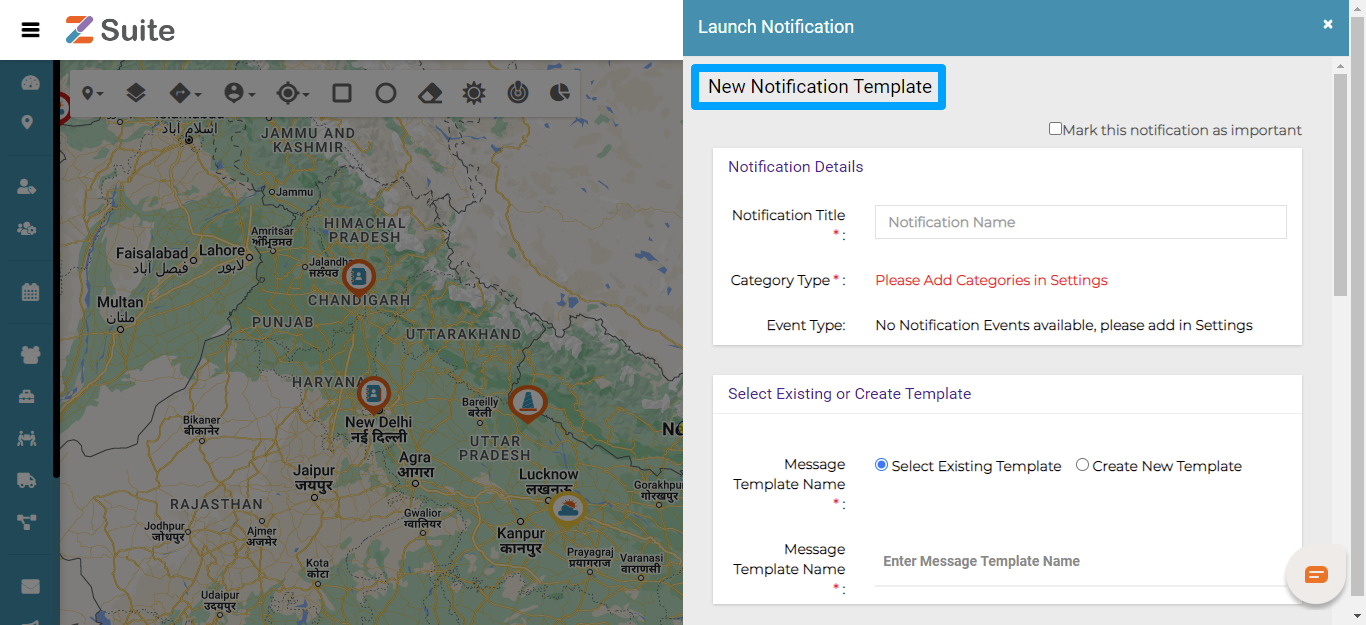
Launch Notification: Incident notification is the process of recording and notifying on worksite events like accidents or events that cause injuries to workers or damages to property or equipment.
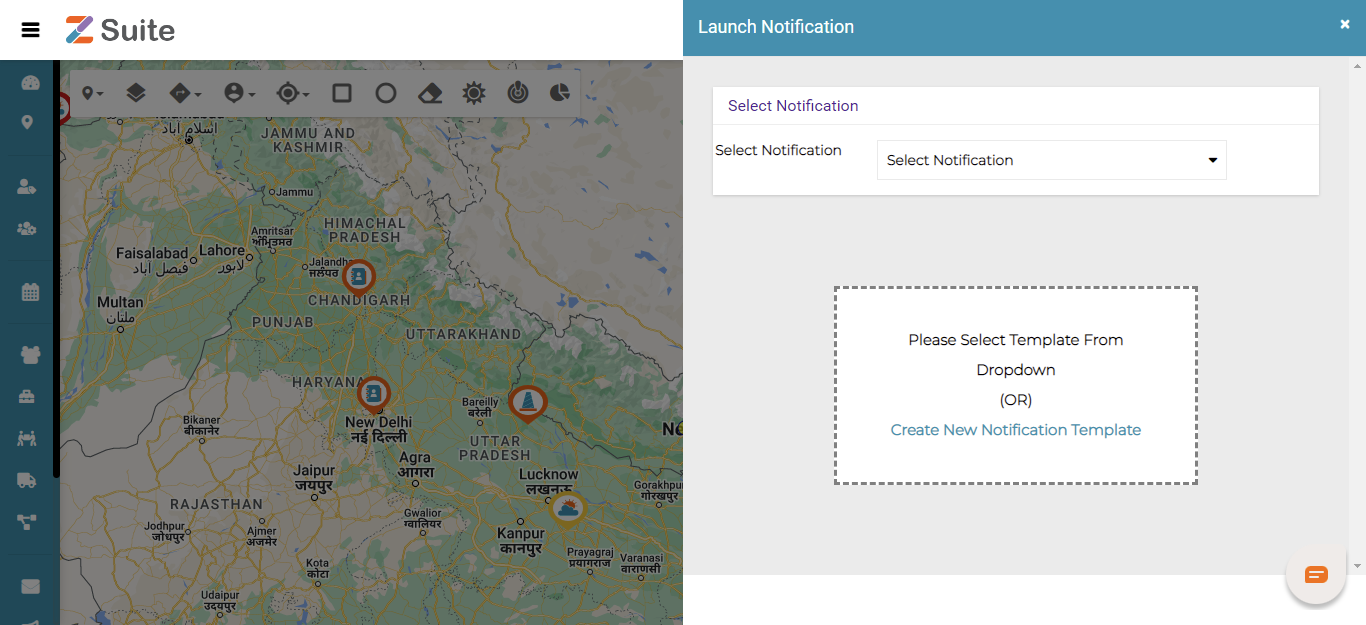
Click on Launch Notification, Select Notification from the dropdown or create a New Notification by clicking on Create New Notification Template.
All the created incident notifications templates can be found in the Select Notification drop down.
Click on Create New Notification Template and fill in the details and click on “Submit”, after that launch the template.
Acknowledge: Click on Acknowledge, to denote that the Threat has been duly taken note of. One acknowledged it displays the “Acknowledged By” details.
Ignore: Click on Ignore if the Threat is of no harm or negligible impact.
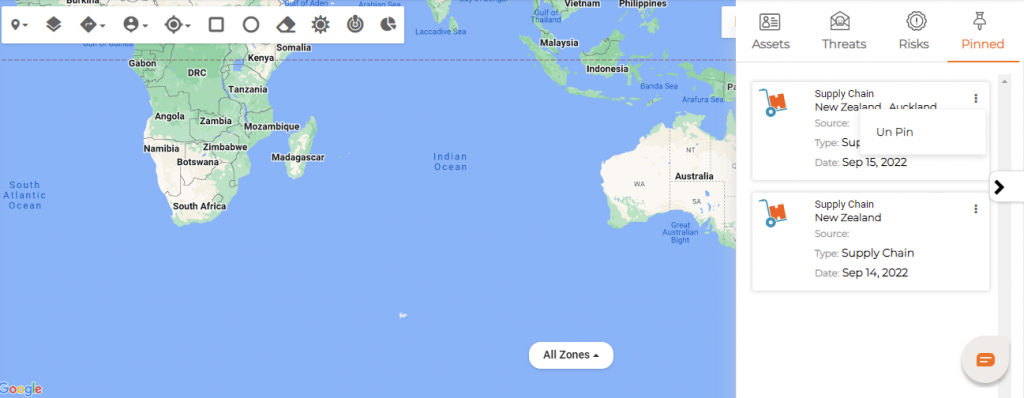
Pin: The user can also Pin and track the Incidents to refer in future in the “Pinned “ tab and unpin if not needed.
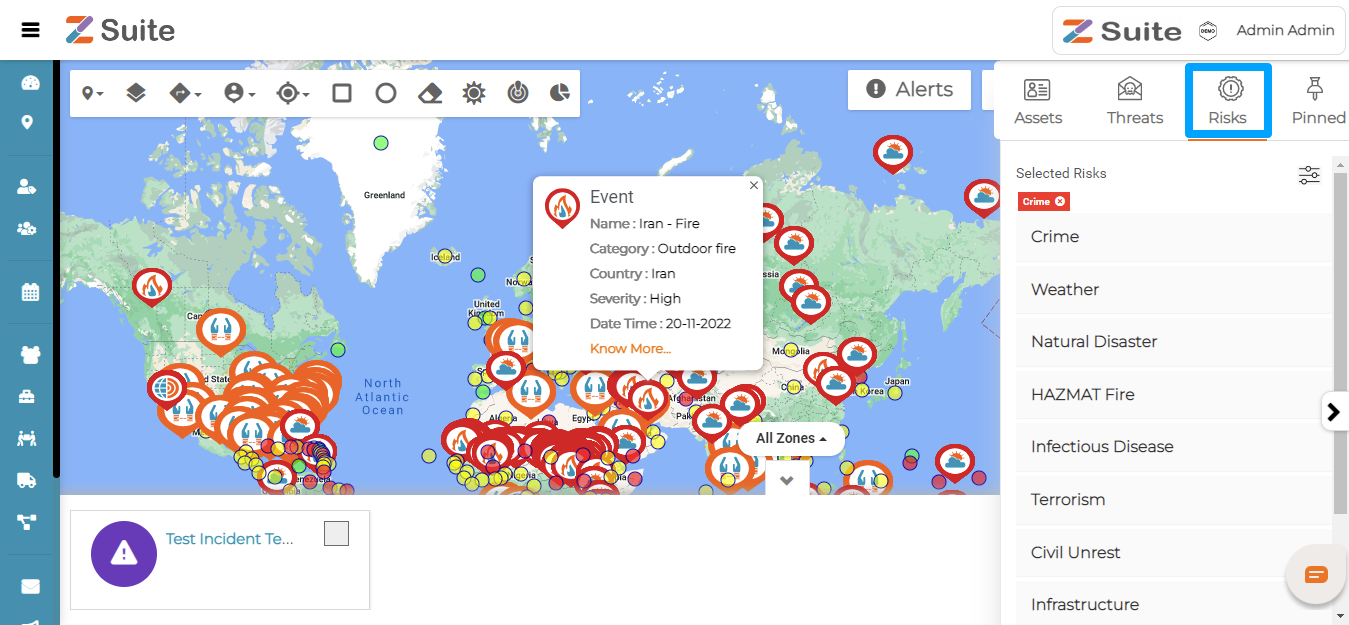
Risks: Risk events are unforeseen or unexpected occurrences triggered that can cause losses for an organization and its stakeholders. Example: Fire, Floods, Earthquake, Hurricane, or other natural disasters, cyber attack, terror, pandemic, etc.,
Step by step process on “How to identify risk alerts” in Zsuite, Quick and Easy with this video.
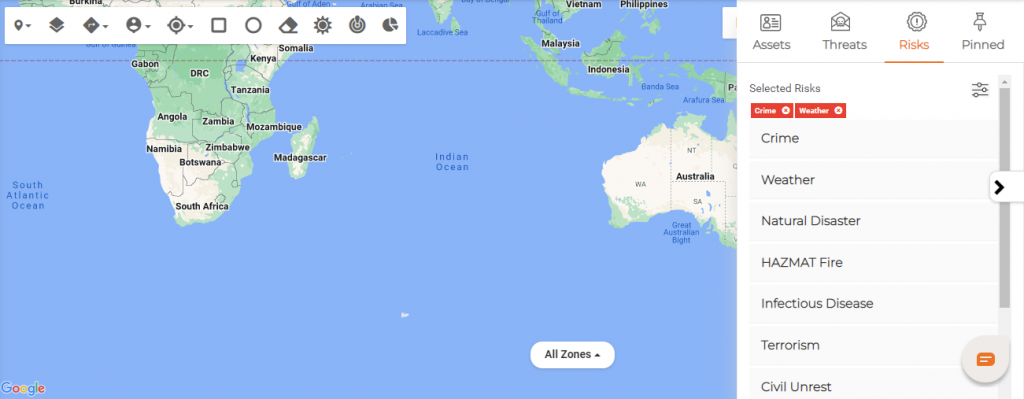
Click on Risk and user can find various Risk Event Categories like Crime, Weather, Natural Disaster, Fire, Infectious Disease, Terrorism, Civil Unrest, etc., Click on the respective categories to populate corresponding Risk details on the map.
Note: Launched notifications and incidents can be checked via the Incident / Notification Zones under the All Zones option appearing below the map.
This completes the overall features of Visual Risk Intelligence (VRI).
Critical Events
Critical Events
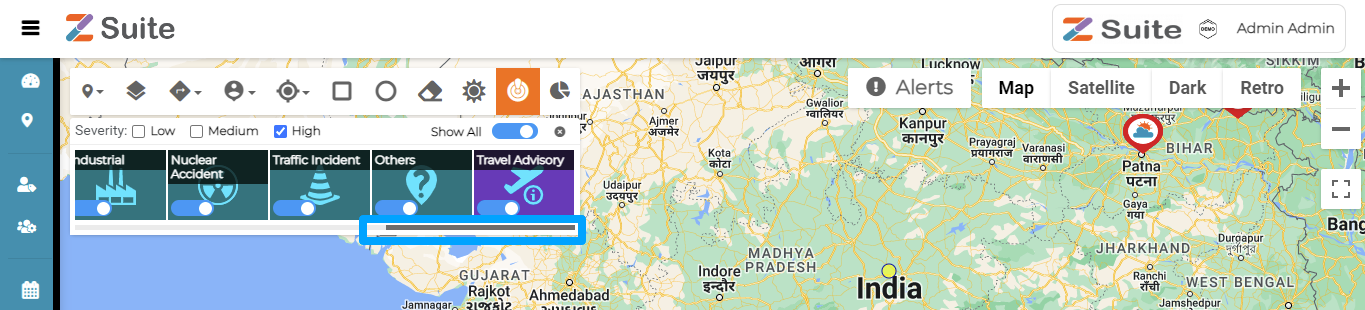
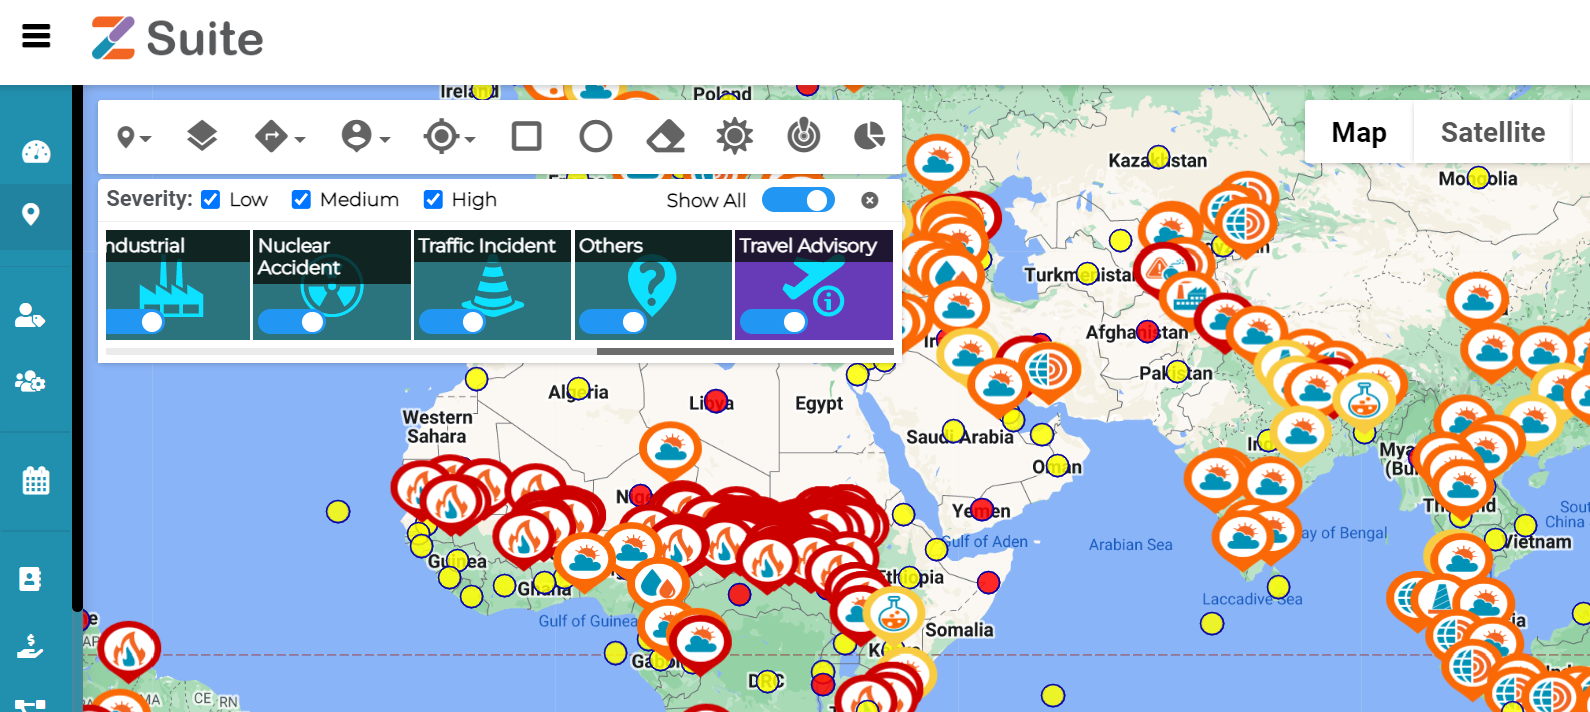
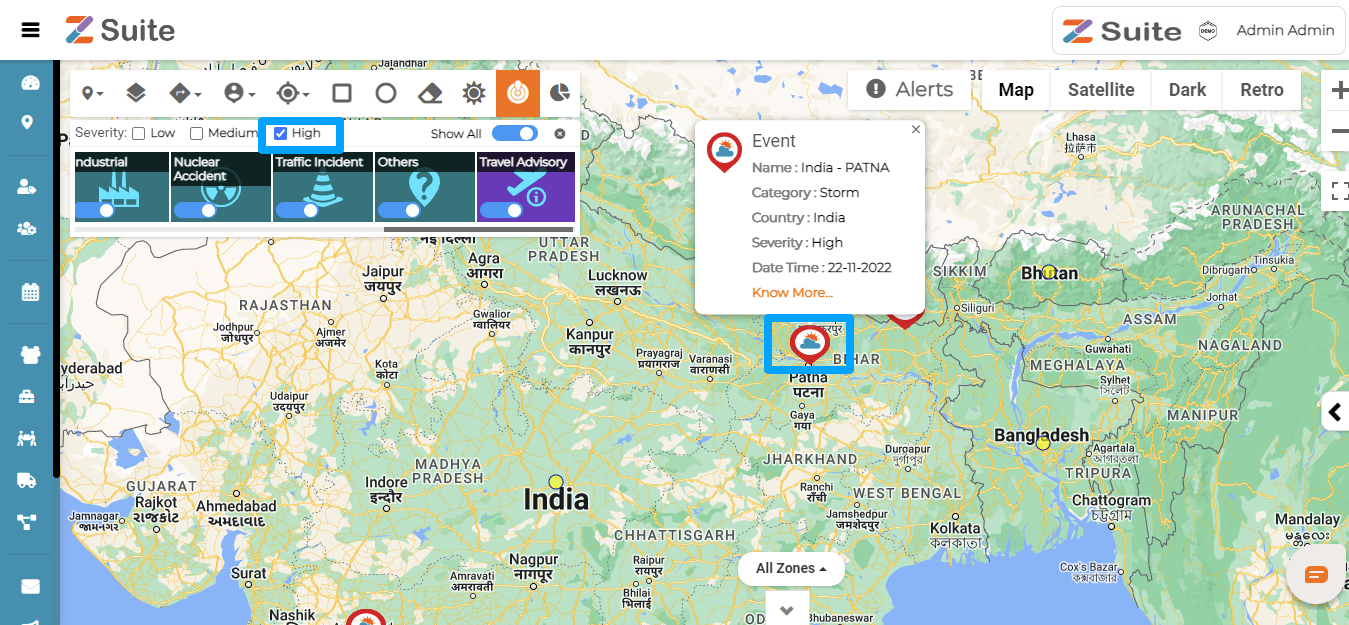
Click on the Critical Events icon to check on various event categories using the horizontal scroll bar below like Weather, Fire, Biological Origin, Critical Infrastructure, Ecological Disaster, Explosion, Geological Hydrological, Industrial, Nuclear Accident, Traffic Incident, Others, and Travel Advisory.
Click on Show All Toggle button to view all the Critical Events
Severity
Click on Severity Level Low, Medium, and High to check on specific event intensity.
Click on the “Know More” in the Event Popup to check the full details of the event.
With “Know More” Users can see more event details like Country, Category, Severity, Source Type, Confidence Score, Description, Source and respective location’s Weather and Traffic Updates.
Click on the Dots in Green (Low Risk) / Yellow (Medium Risk) / Red (High Risk) to check the related Travel Advisory.
A travel advisory is a warning to provide information about the relative safety of travelling to or visiting one or more specific countries or destinations.
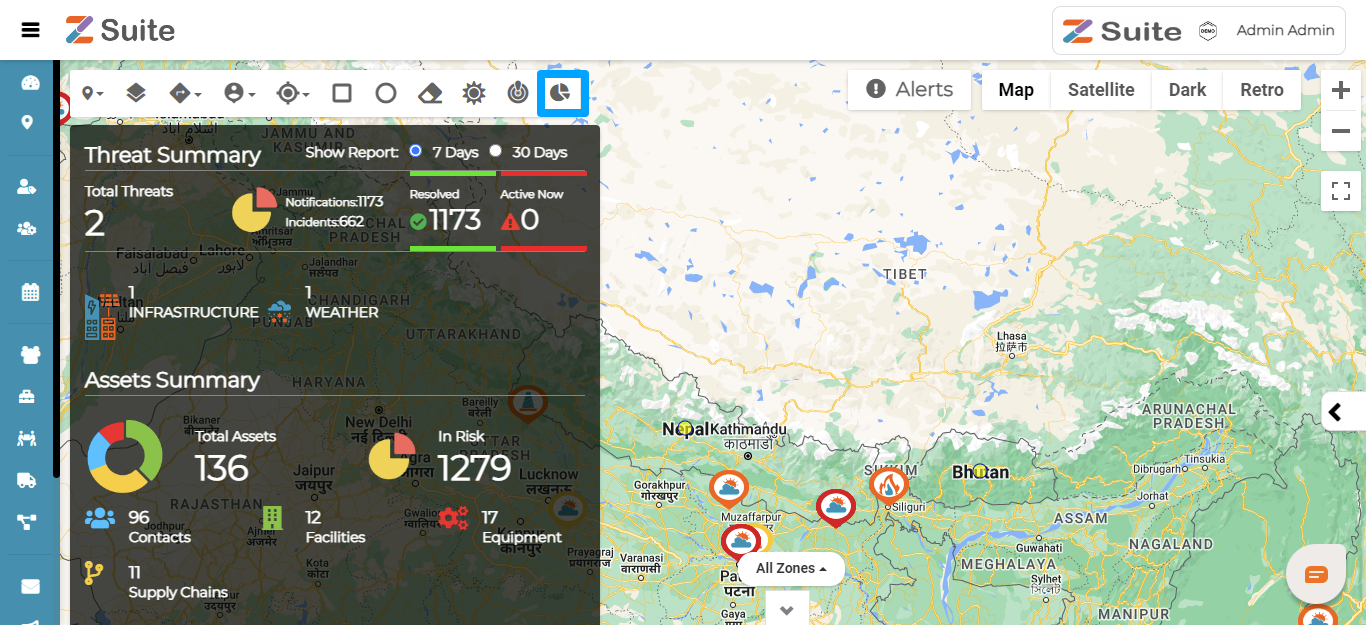
Threats and Assets Summary:
Users can see the Threats and Assets Summary Dashboard for a week or month.
In Threat Summary users can see count of Notifications and Incidents, Count of Active and Resolved Incidents and Type. In Assets Summary users can see count of Total Assets, Count of Contacts, Facilities, Equipment, Supply Chain and Risks.
Polygon/Circle
Polygon / Circle
Polygon:
Users can draw a polygon on a map around the location and find the contacts in that particular location.
Circle:
Users can draw a circle on a map around the location and find the contacts in that particular location.
Eraser / Reset Icon: Users can erase and clear all the existing searches or plotted data
and reset the map to its original state.
Day / Night: The Day and Night World Map shows the Sun’s current position and where it is night and day throughout the world at that point of time.
Users can remove the Night Zones for a clear view.
Alerts
Alerts:
The alerts symbol on the right gives you more information the alerts that every user need look through
Step by step process on “How to identify risk alerts” in Zsuite, Quick and Easy with this video.
Click on the alerts symbol on the right to open a tab where users get all kinds of alerts and notifications regarding the assets, contacts, members and alerts from across organizations on the risk events happening near the map view selected. And the notifications from across the organizations on the predicted issues and the pinned important alerts by the user.
Checking the check boxes in the first tab which would show contacts on the map, Checking members will also show members and clicking on the assets will reveal the logo will display the assets of the organization in the map view.
Click on the Second tab with notifications Icon to see all the incidents that are triggered.
We can activate the incident, pin an incident, Acknowledge or Ignore an incident from the list of options on all the all incidents tab
Alerts: clicking on the third tab will give the different alerts to users that need to attend to the issues and we have an option pin the alerts.
Contact Legend:
To set contact legend for Maps go to settings -> Maps, here you can create new Map Lists and Weather Layer Colours.
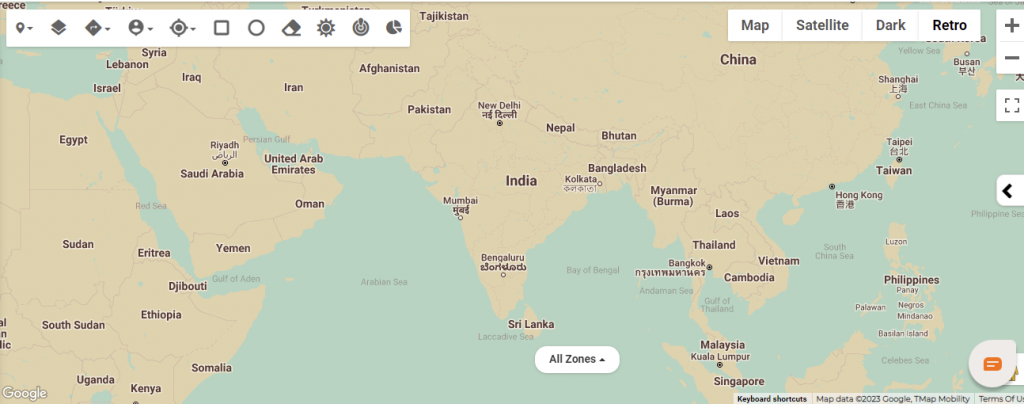
Map Views
Map Views
Regular Map View: A Map view displays a map obtained from a Maps service when focused, it uses keypresses and touch gestures to move the map.
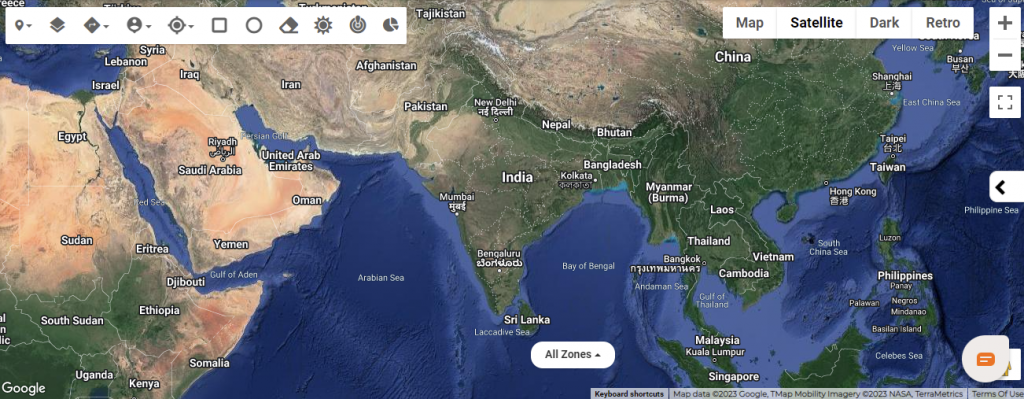
Satellite View: Satellite images (also Earth observation imagery) are images of Earth collected by imaging satellites operated by governments and businesses around the world,
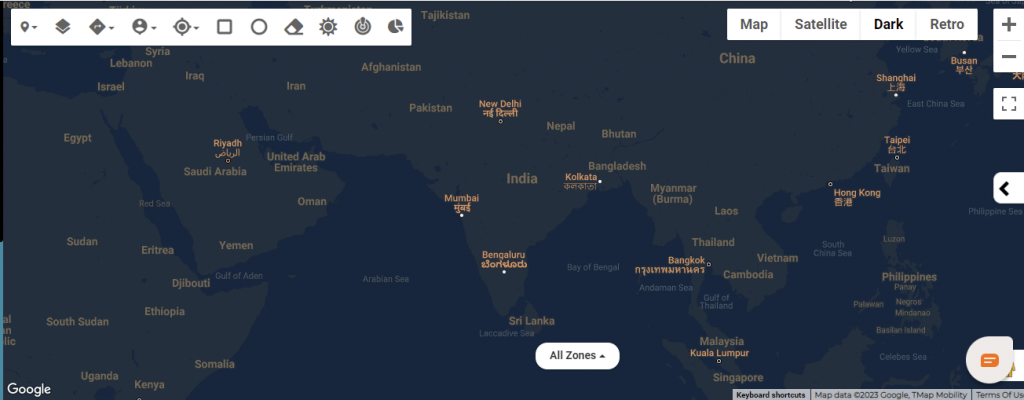
Dark View: The dark style is a black map designed to minimize the distraction of users, who can focus on data you are presenting on top of them without being interrupted.
Retro View: A retro style map appears better and enhances readability when zoomed in on a location.
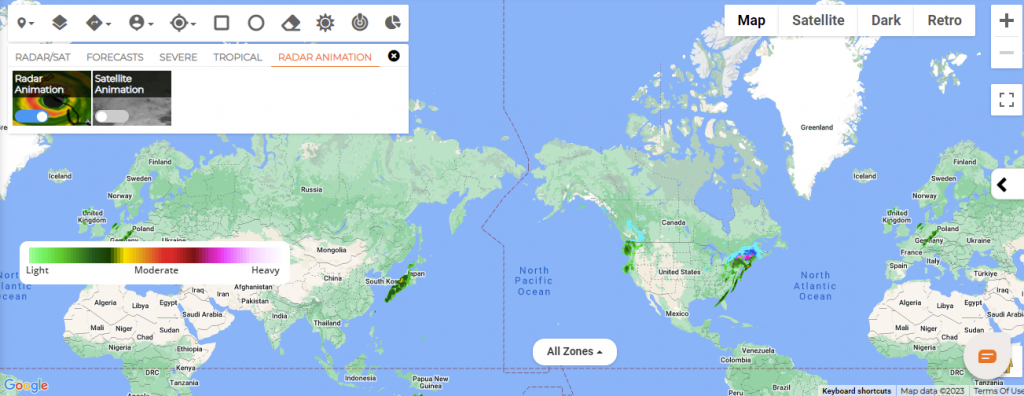
Radar Animation
Radar Animation
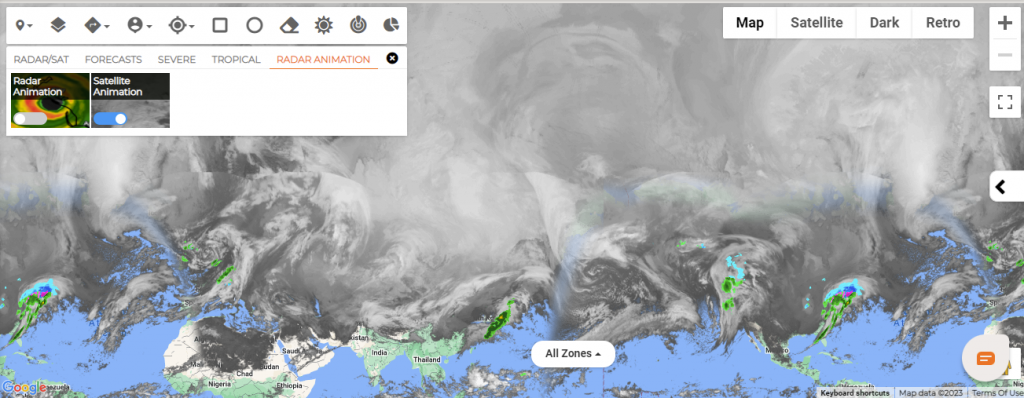
Satellite Animation:
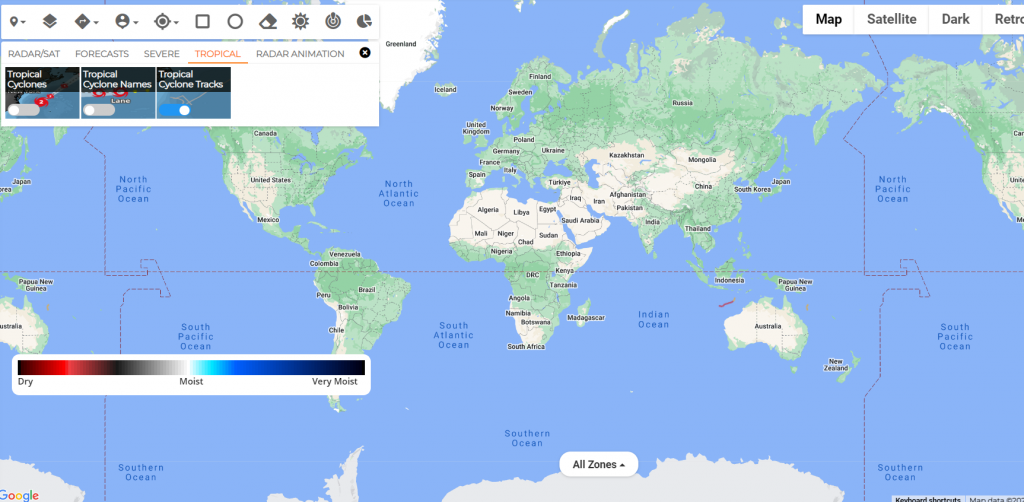
Tropical
Tropical
Tropical Cyclones: Tropical cyclones, also known as typhoons or hurricanes, are among the most destructive weather phenomena. They are intense circular storms that originate over warm tropical oceans, and have maximum sustained wind speeds and heavy rains.
Tropical Cyclones Names: It’s important to note that these storms all exhibit the same features; they are just called differently depending where they’re located.
Example: Hurricane: Atlantic and Eastern, Central Pacific oceans. Typhoon: Western Pacific Ocean. Cyclonic storm: Northern Indian Ocean. Tropical cyclone: Southern Indian Ocean.
The practice of naming these storms began years ago in order to help in the quick identification of storms in warning messages and makes it easier for the media to report and heightens interest in warnings and increases community preparedness.
Tropical Cyclones Tracks: Tropical cyclone track forecasting involves predicting where a tropical cyclone is going to track over the next five days, every 6 to 12 hours.
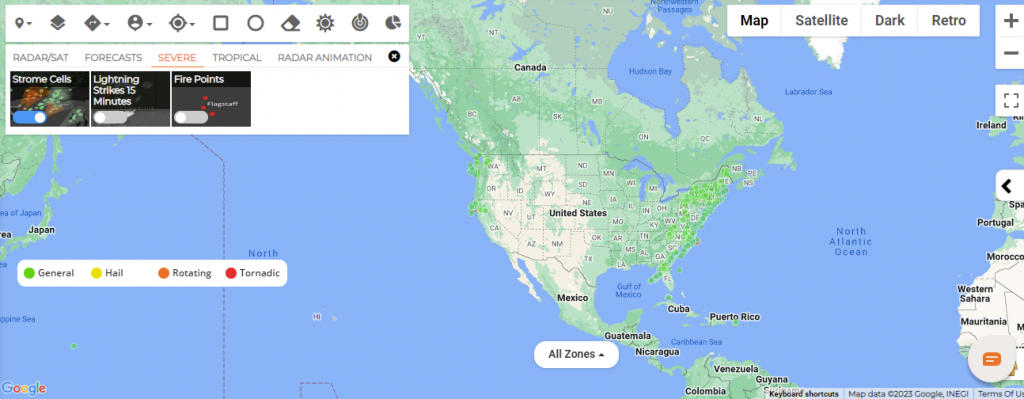
Severe
Severe
Step by step process on “How to view critical events depending on severity ” in Zsuite, Quick and Easy with this video.
Strom Cells: Storm cell is an air mass formed by powerful updrafts and downdrafts moving in convective loops, the smallest unit of a storm system. A supercell is a long-lived (greater than 1 hour) and highly organized storm feeding off an updraft (a rising current of air) that is tilted and rotating.
Lightning Strikes 15minutes: A lightning strike or lightning bolt is an electric discharge originate in a cumulonimbus cloud.
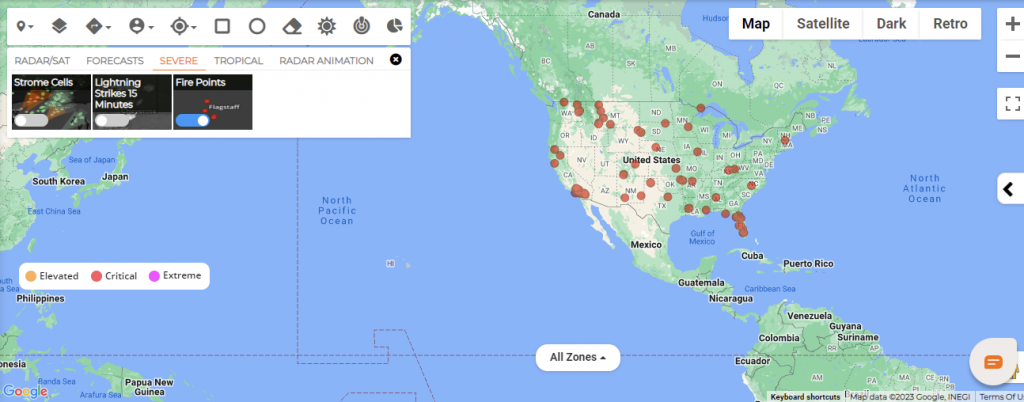
Fire Points: The hotspots depicted in the map represent locations with possible active fires. Hotspots may go undetected due to cloudy conditions or partial satellite pass.
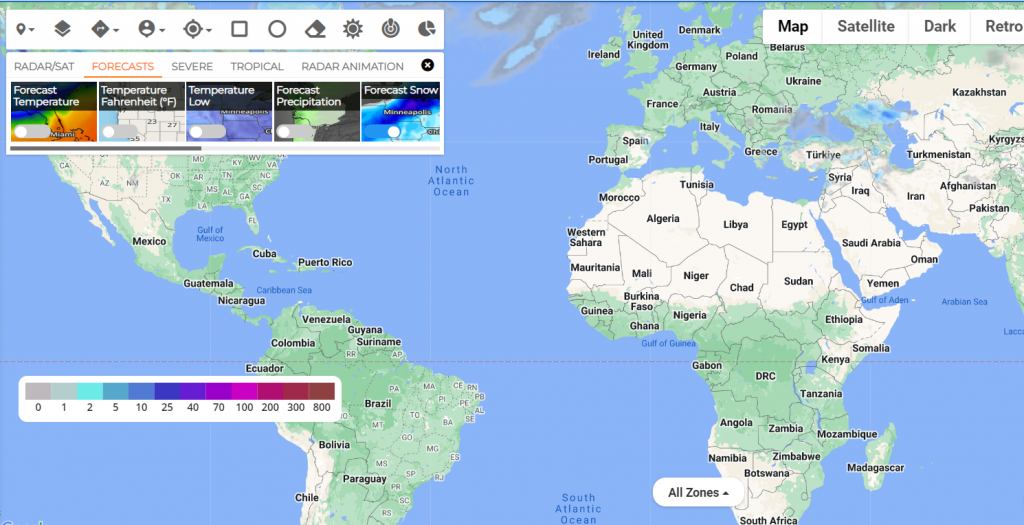
Forecasts
Forecasts
Forecast Temperature: Temperature forecasts are based on low or high temperature, precipitation and this forecast helps agriculture, traders, commodity markets, utility companies, etc., to estimate seasonal demand.
Temperature Fahrenheit (°F): The Temperature map shows the current temperatures color contoured that underlies the common notions of hot and cold; something that is hotter generally has the greater temperature.
Temperature Low: Low Temperatures Forecast Map with Color Coded Temperatures Showing the current Forecasted Lows.
Forecast Precipitation: A Forecast precipitation map shows an animated visualization of forecasted rain and snow across.
Forecast Snow: The snow forecast map shows the forecast snowfall in inches.