IT Event Analytics
IT Incident analytics provides structured data to identify what happened during an outage, discover what parts of the system were involved, who attended and how the problem was handled, the root cause or why it happened, what can be done to prevent or minimize the risk of recurrence from what has been learnt.
Step by step process on “How to access IT event analytics” in Zsuite, Quick and Easy with this video.
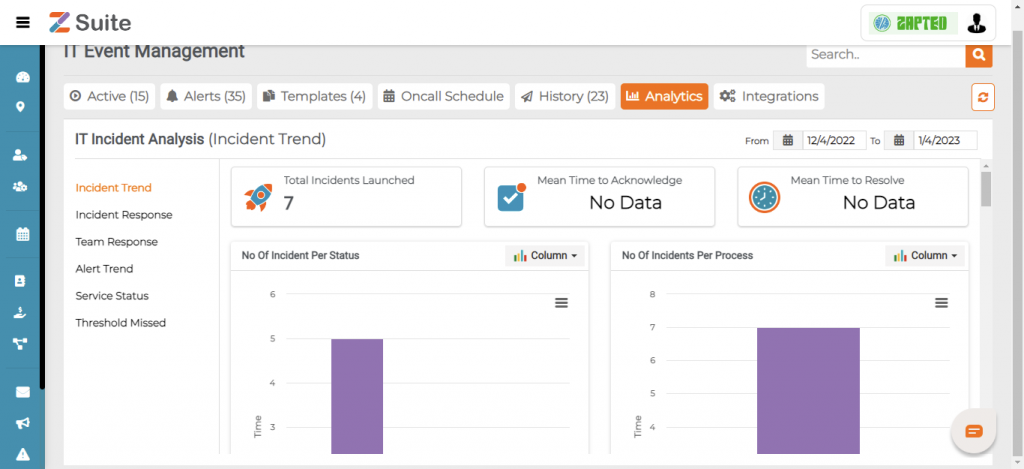
Click on IT Event Analytics to view the Details like Incident Trend, Incident Response, Team Response, Alert Trend, Process Close Times, Service Status and Threshold Missed.
Viewing a history:
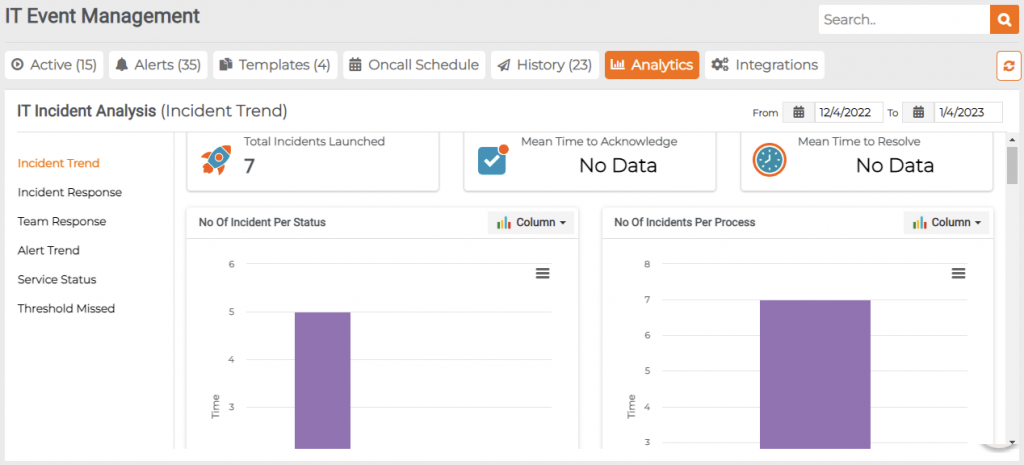
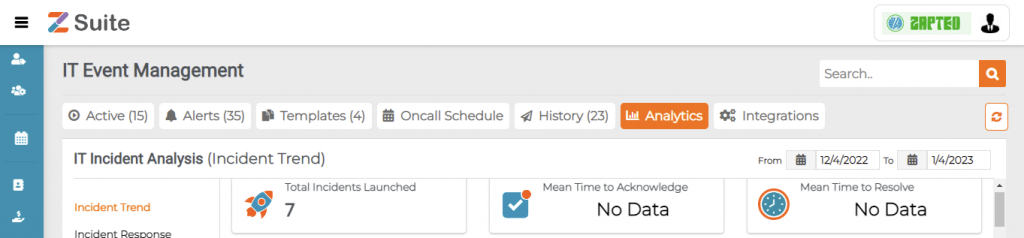
Incident Trend: Click on Incident Trend Here are the Details you find for past incidents launched, Mean Time to Acknowledge, Mean Time to Resolve.
Mean Time to Acknowledge: Mean time to acknowledge is the average time taken from when an alert is triggered to when the work begins on the alert. This metric is useful for tracking alert system’s efficiency and the response team’s responsiveness.
MTTA is calculated by adding up the time between alert and acknowledgement, then dividing by the number of incidents.
For example: If you had 10 incidents and there was a total of 60 minutes of time between alert and acknowledgement for all 10, you divide 60 by 10 and come up with an average of 6 minutes.
Mean Time to Resolve: Mean time to resolve is the average time taken to fully resolve a incident. This includes the time spent detecting the incident, diagnosing, fixing and also ensuring that the incident would not recur again.
It is the difference between extinguishing a fire and fireproofing the vulnerable area post extinguishing.
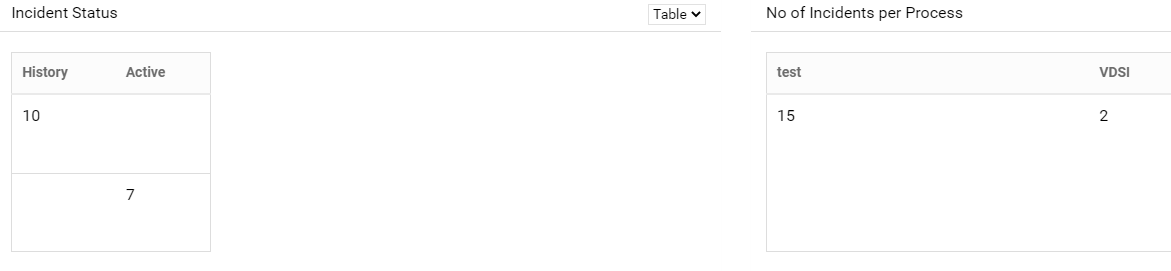
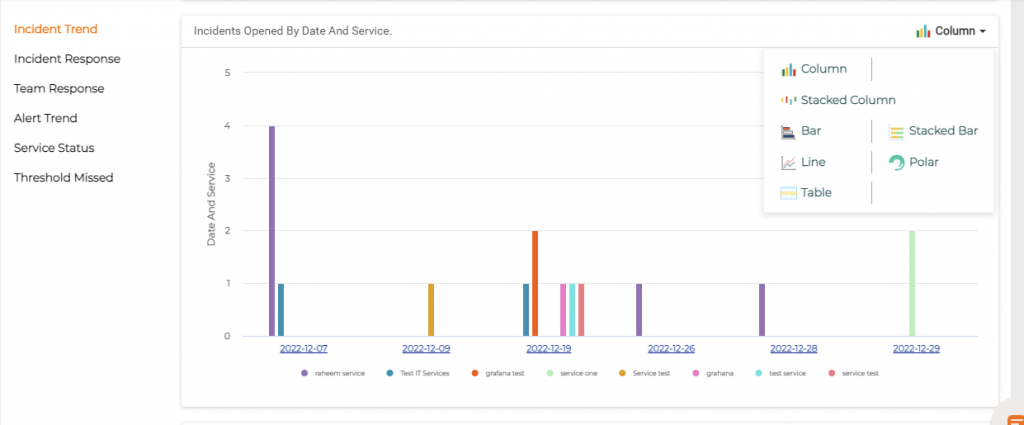
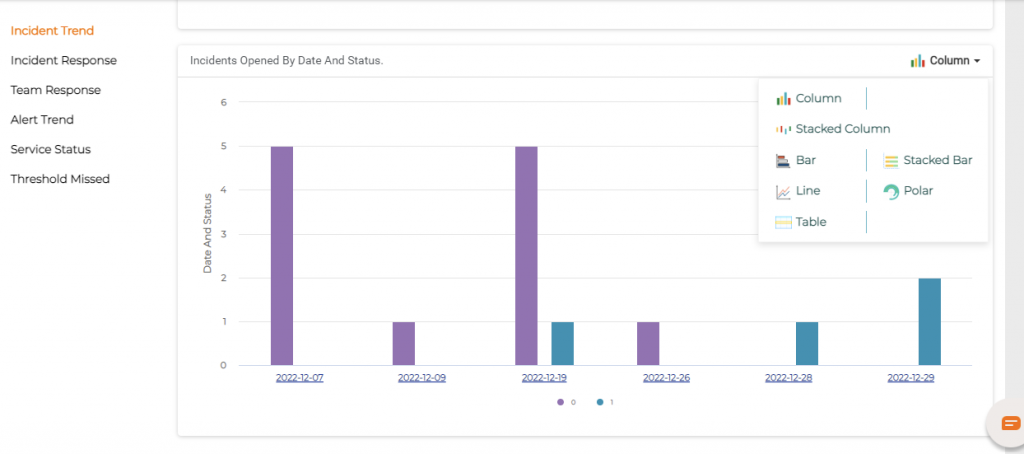
Incident Status & Number of Incidents per process view modes :
Here we have three types of modes are there like Table, Pie and Bar
In Table View Mode
In Bar view Mode :
Incidents opened by Date and Service:
Incidents opened by Date and Status:
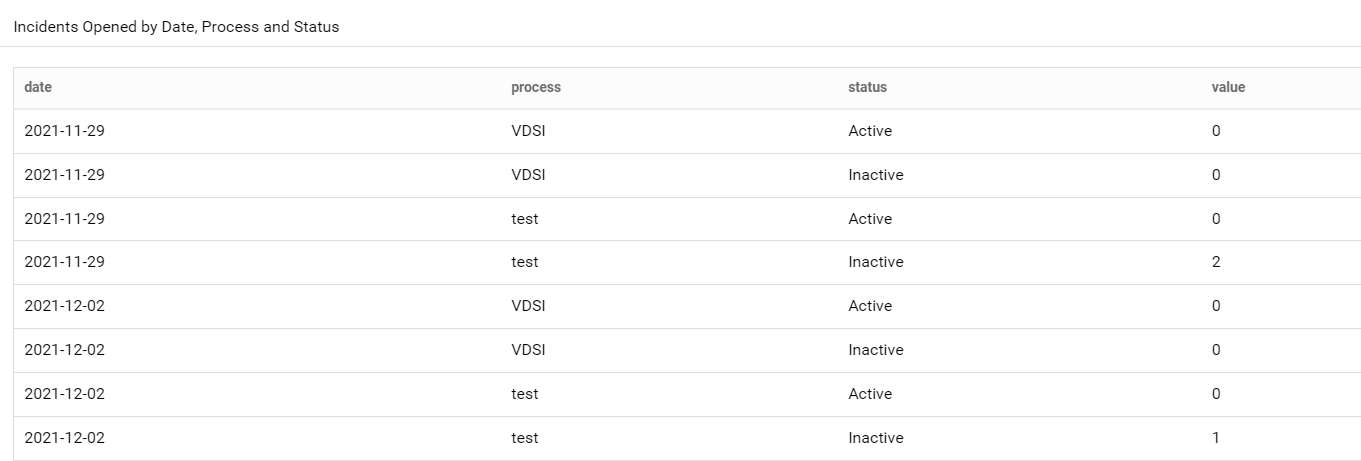
Incidents opened by Date, Process and Status
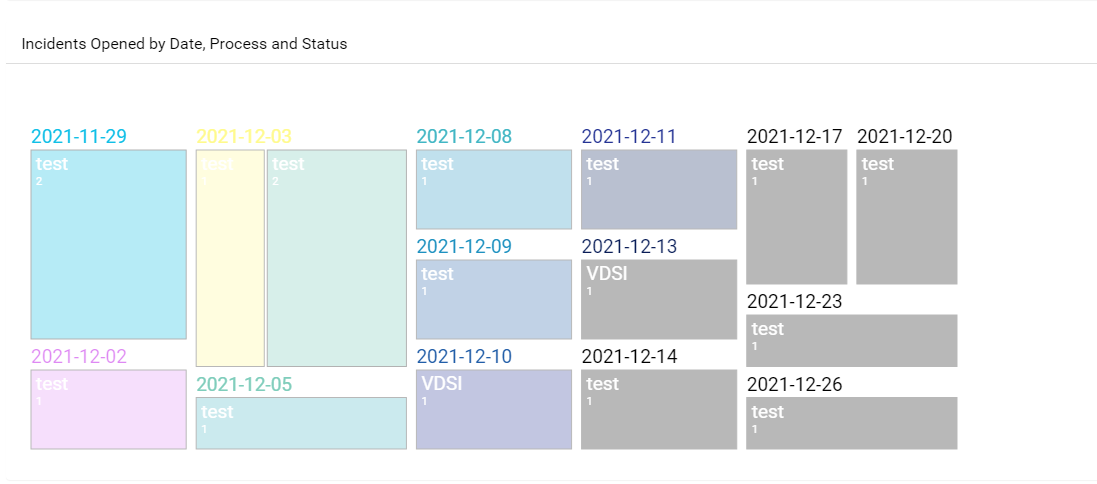
In Table view Mode
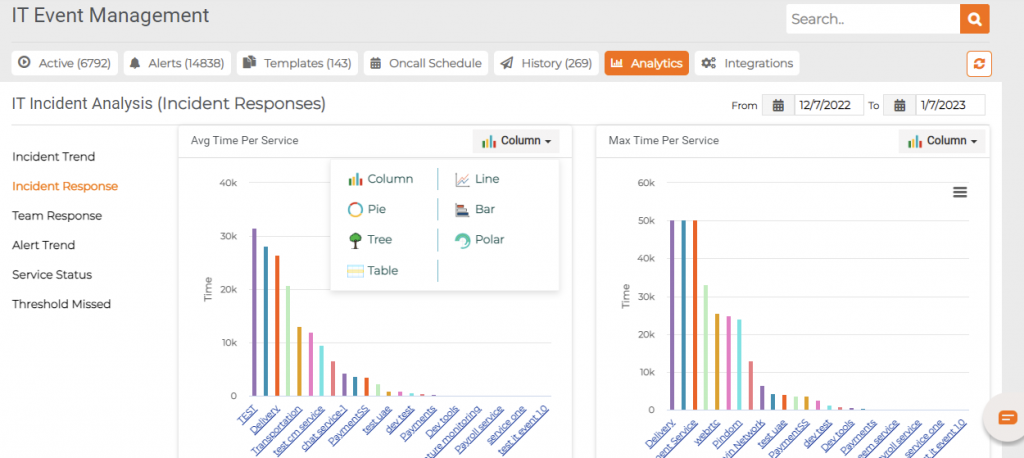
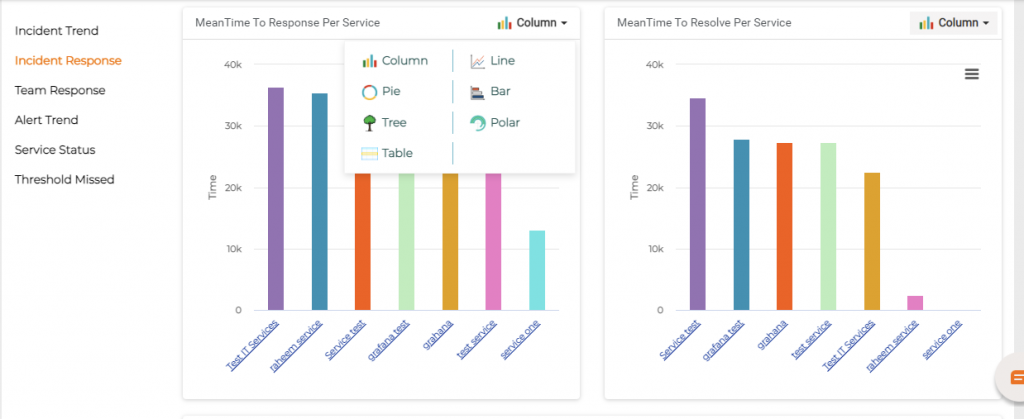
Incident response: Click on Incident Response and users can view the Average Time Per Service, Max Time Per Service.
Mean Time to Acknowledge Per Service and Mean Time to Resolve per Service
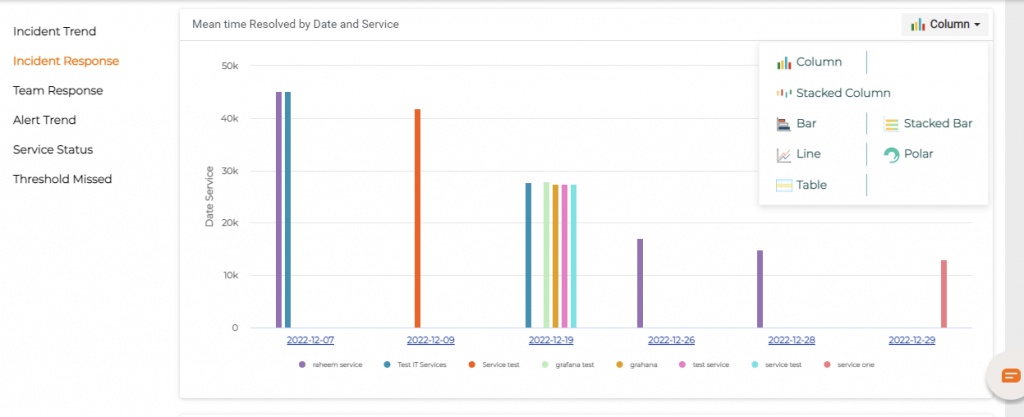
Mean Time Responded by Date, Service, and Priority
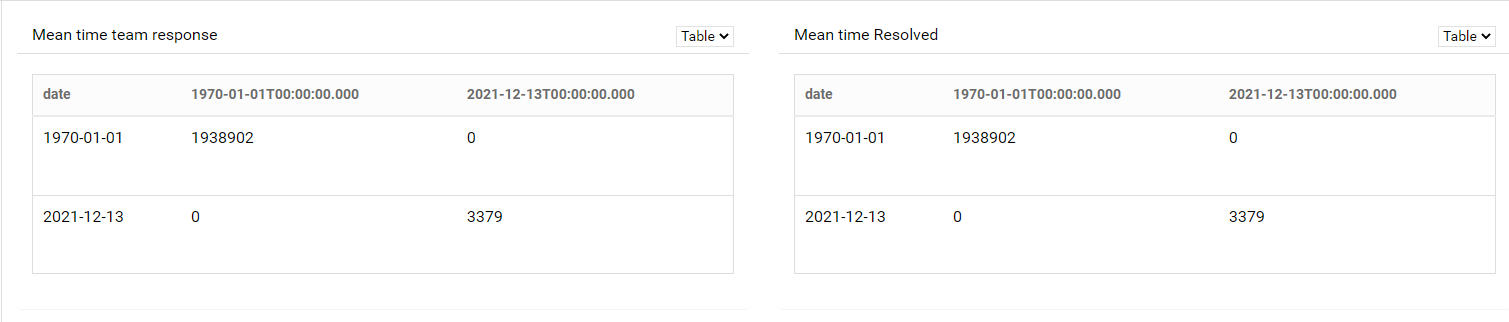
Team Response: Click on Team response to find the details like Mean Time team Response, Mean Time Resolved.
In Table view Mode
Mean Time Team Response and Mean Time-Resolved
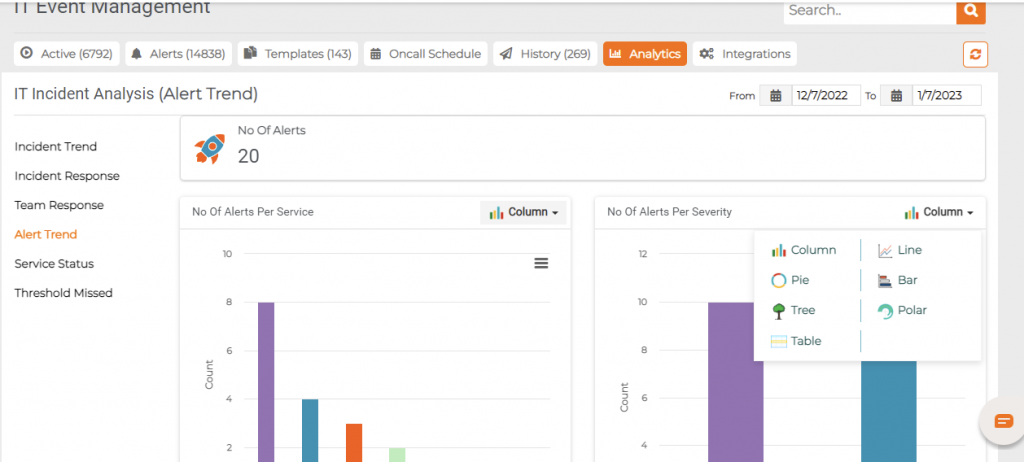
Alert Trend: Click on Alert Trend Response to find Details such as Number of Alerts Per Service, Alerts by Date, and Service.
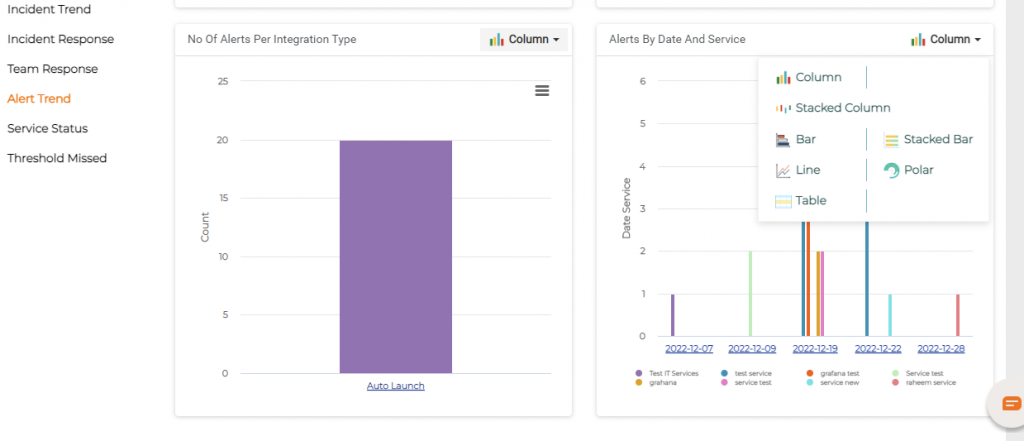
Number of Alerts Per Integration Type and Number of Alerts Per Severity
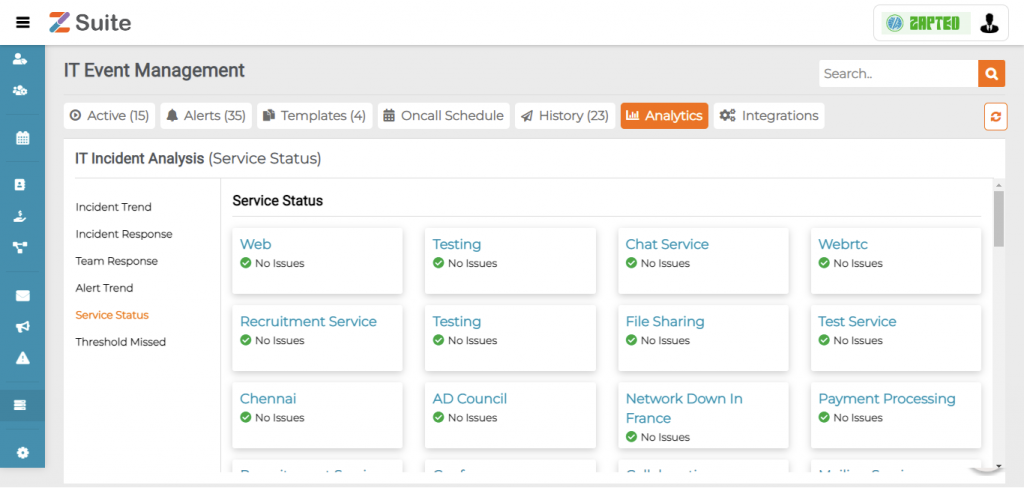
Service Status: This shows the current operational status of the service like No Issues or Incidents.