Analytics
Incident analysis is a process for identifying what happened, when and where it happened, why it happened, what can be done to reduce the risk of recurrence through what has been learnt.
Step-by-step process on “How to access analytics of incidents” in Zsuite, Quick and Easy with this video.
Incident Analytics contains aggregated incident statistics with which the user can click and view the data in a variety of graphs in dashboards to analyze the history of your incident response over time.
All the Incident Analytics will be displayed here. You can search between dates to know the respective analytics.

Here you can view the Total number of Incidents Launched, Mean Time to Acknowledge and Mean Time to Resolve those Incidents.
Mean Time to Acknowledge: Mean time to acknowledge is the average time taken from when an alert is triggered to when the work begins on the alert. This metric is useful for tracking alert system’s efficiency and the response team’s responsiveness.
MTTA is calculated by adding up the time between alert and acknowledgement, then dividing by the number of incidents.
For example: If you had 10 incidents and there was a total of 60 minutes of time between alert and acknowledgement for all 10, you divide 60 by 10 and come up with an average of 6 minutes.
Mean Time to Resolve: Mean time to resolve is the average time taken to fully resolve a incident. This includes the time spent detecting the incident, diagnosing, fixing and also ensuring that the incident would not recur again.
It is the difference between extinguishing a fire and fireproofing the vulnerable area post extinguishing.
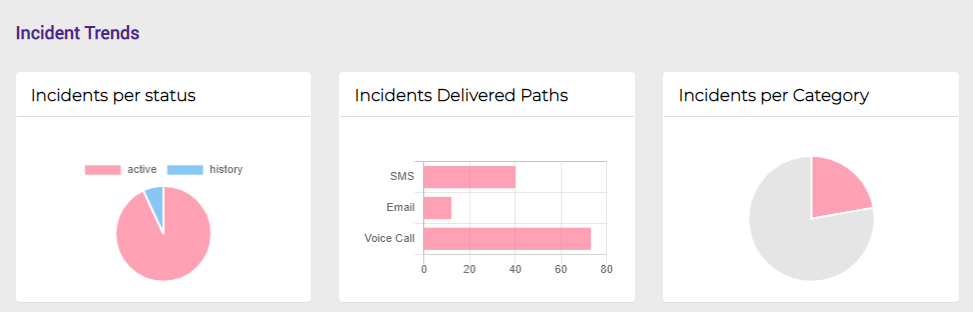
The above graph shows the Incidents Per Status i.e. Active and History, incidents Delivered Paths i.e. Via SMS, Email and Voice Call and Incidents Per Category.
Incidents Opened by Date and Status: The graph shows the Incidents Opened by Date and Status i.e. Active and Inactive.
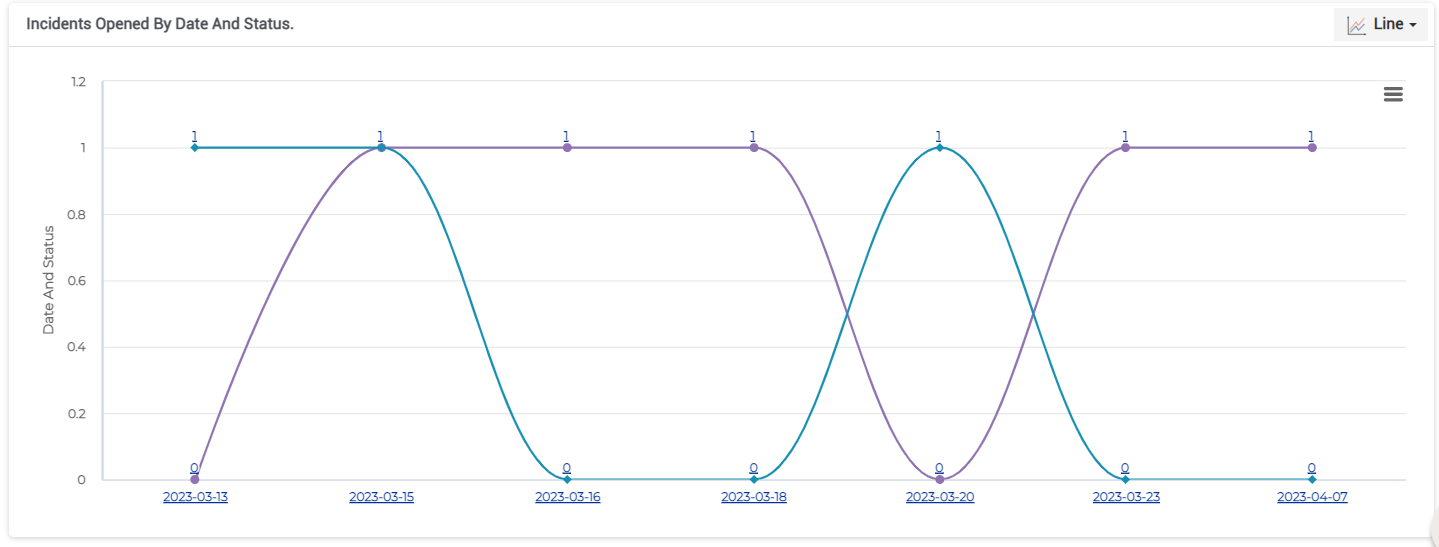
Incidents Opened by Date and Category: The graph shows the Incidents Opened by Date and Category.

Incidents MTTA Analysis:
MTTA shows how responsive the support teams are to incidents. A lower MTTA means acknowledging and responding to the incidents that impact the critical processes in a timely manner. This results in lesser downtime, fewer disruptions, and happier customers.
A higher MTTA means the support team takes a longer time to acknowledge or that responders are not responding or available when they receive an alert. This could be due to extended shifts or overwhelming alerts.
To solve this, appropriate escalation process can be put in place to offer additional resources, if the first in line responders fail to address in the specified timeframe.
Monitoring MTTA provides insights into how to make long-term improvements to team responsiveness and streamline incident management efforts.
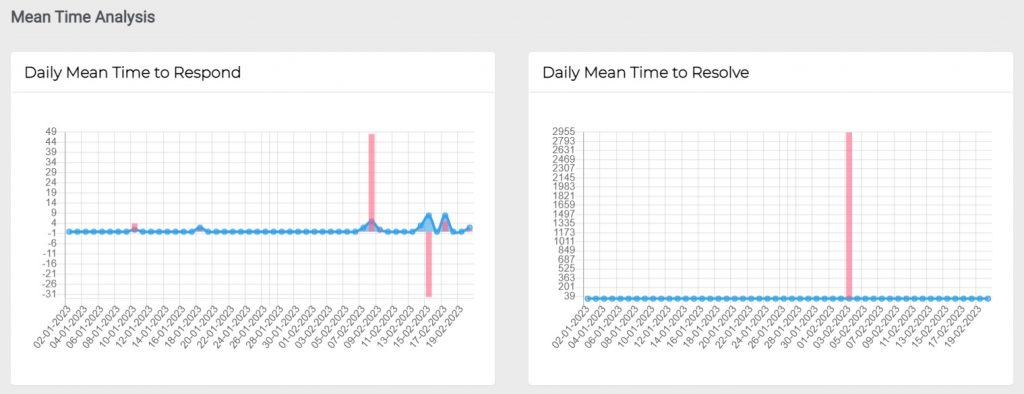
Mean Time Analysis: This graph gives you the details of the Daily Mean Time to Respond and the Daily Mean Time to Resolve.
Daily Mean Time to Respond is the average time (daily) to recover from issue or failure from the time when the first alert received.
Daily Mean Time to Resolve is the average time (daily) it takes to fully resolve a failure. This includes the time spent on detection, diagnosis, resolving and also ensuring that the failure would not recur again.
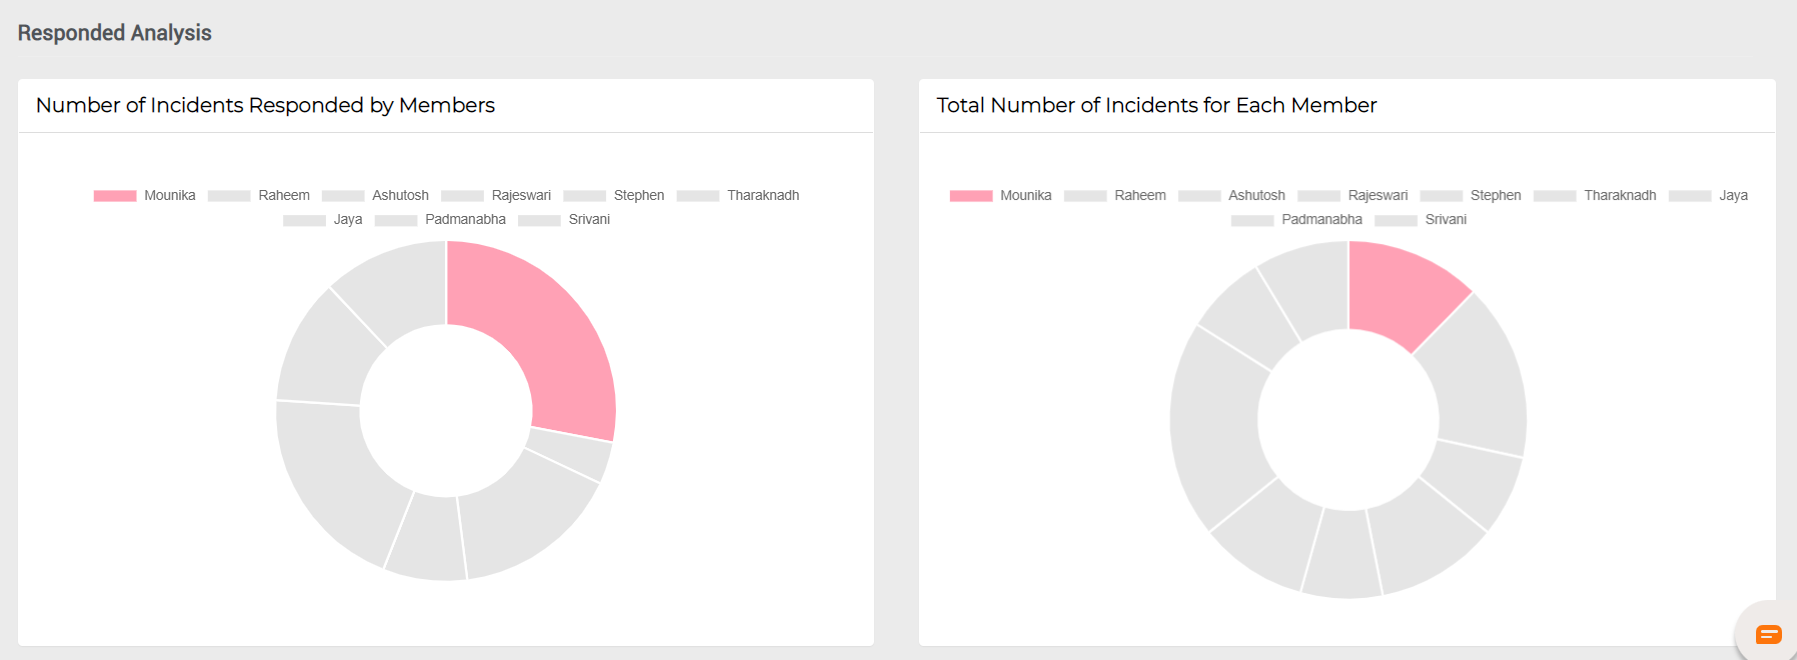
Responded Analysis: This graph gives you the details of the number of incidents that are responded by team and total number of incidents per team.