Contact: Contact is the person identified by an Organization to notify through the Z suite application. Example: Employee, Customer, Supplier, Vendor, or Contractor.
Assets: Assets are the organizational resources essential to operate and achieve organization objectives. Example: People, Premises, Process and Providers.
IT CMDB: An IT Configuration Management Database is a database used to store IT asset information to essential for an organization’s IT service management (ITSM). Example: Hardware, Software, Network, Voice, Data Systems, etc.,
Incident: Incident is an occurrence due to unforeseen circumstances, which, if not handled duly, can turn severe to disrupt or deteriorate organization’s assets and services. Example: Personnel Absence, Power Outage, Network Failure, Transport Disruption.
IT Incident: IT incident refers to an unexpected event that disrupts business operations or impacts the performance. Example: System Slowness, Corrupted data, Login Issues, etc.,
Dashboards
Dashboards in detail
Dashboards are useful in monitoring, measuring, and analyzing the current state of a business, department, team, or specific process. Dashboards helps to track periodic progress, spot signs for early warning, identify areas of improvement, and make timely decisions.
Step by step process on “Feature Details” in Z suite, Quick and Easy with this video.
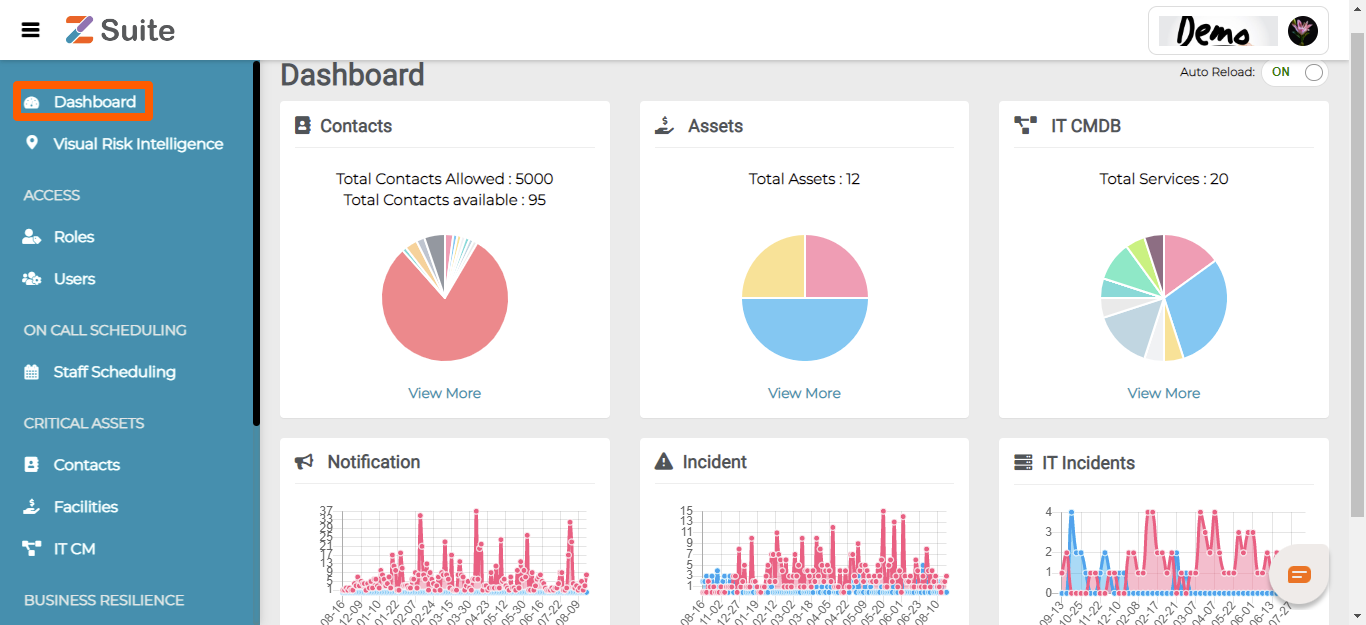
Select “Dashboard” from the menu options listed in the left pane.
Here you can see the respective dashboards for “Contacts”, “Assets”, “IT Services”, “Notifications”, “Incidents” and “IT Incidents”.
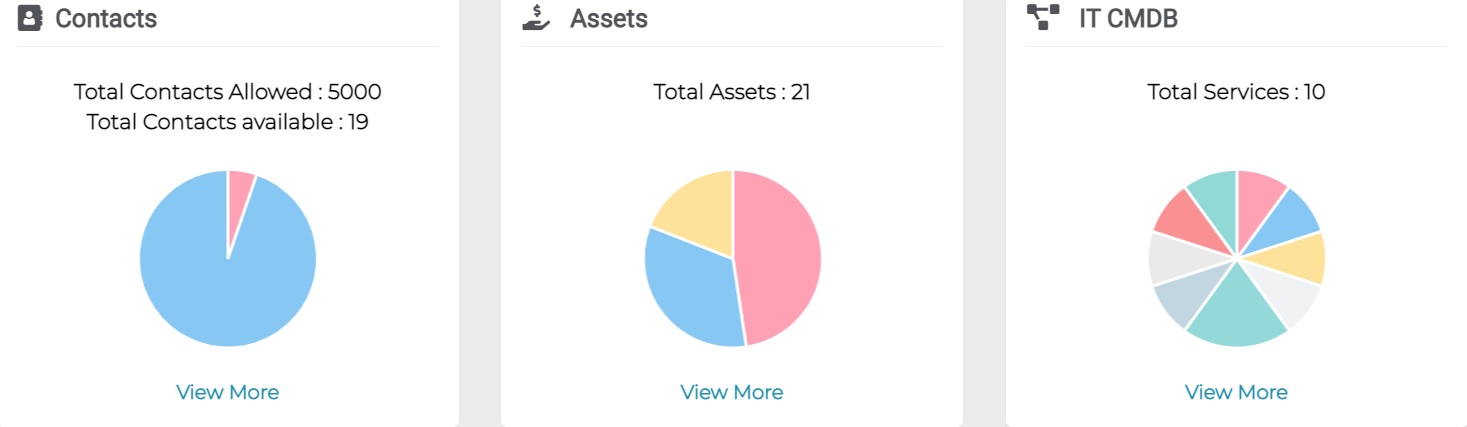
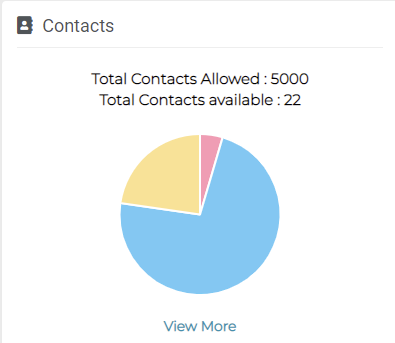
Total Contacts Allowed are the Contacts that the Organization can add i.e., here you can add up to 5000 contacts. Total Contacts available are the Contacts you have at present.
Each colour in the graphical chart indicates a specific Contact Type like Employee, Manager, Customer, Supplier etc. Clicking on the View More option will redirect to the detailed view of Contacts.
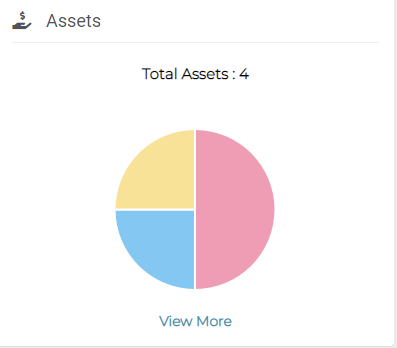
Total Assets are the Assets that the Organization have added and available at present.
Each colour in the graphical chart indicates a specific Asset Category like Facility, Equipment and Supply Chain. Clicking on the View More option will redirect to the detailed view of the Assets.
Services:
This is the Overview of the Services.
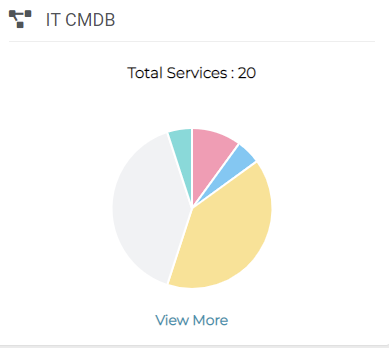
Total Services are the Services that the Organization have added and available at present.
Each colour in the graphical chart indicates a specific Service. Clicking on the View More option will redirect to the detailed view of the Services.
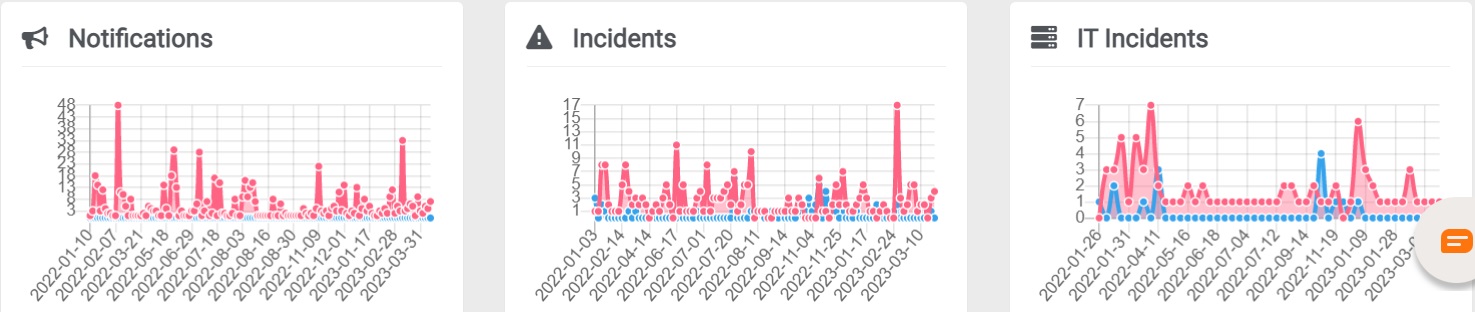
Notifications:
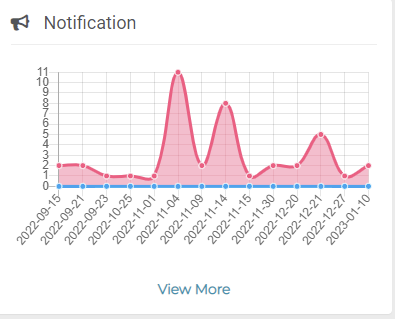
The Notifications Graph shows the number of Notifications triggered date wise.
Clicking on the View More option will redirect to the detailed view of the Notifications.
Incidents:
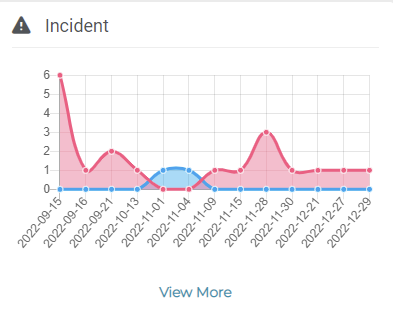
The Incidents Graph shows the number of Incidents triggered date wise.
Clicking on the View More option will redirect to the detailed view of the Incidents.
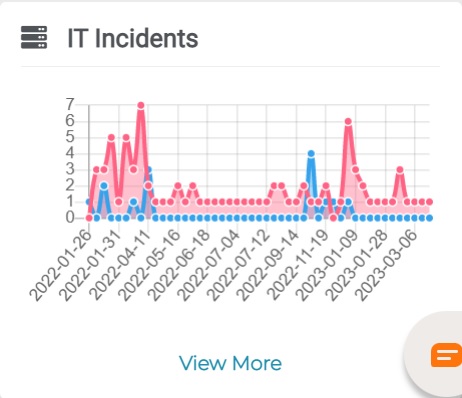
IT Incidents:
The IT Incidents Graph shows the number of Incidents triggered date wise.
Clicking on the View More option will redirect to the detailed view of the IT Incidents.
Who can access Dashboards features?
Who can access Dashboards features?
Users in all roles have access to the dashboard, with respective to their role. For example, the administrator can access all, but the Incident Manager can only access only the IM associated subsections.
Dashboards Overview
Dashboards Overview
This chapter introduces the features of the Zsuite Dashboard. The Dashboard is the landing page for users .
Z suite dashboard is a graphical user interface which provides key indicator views relevant to contacts, assets, IT CMDB and Non IT and IT Incidents.
A dashboard provides a graphical view of relevant key performance indicators / metrics / data points.