Assets: Assets are the organizational resources essential to operate and achieve organization objectives.
Example: People, Premises, Process and Providers.
Threat: Threat is the potential of a natural or man made threat-source to accidentally or intentionally exploit a vulnerability.
Examples for Natural Threats: Rainstorms, Cyclones, Floods, Earthquakes,
Examples for Man Made Threats: Pollution, Chemical Spills, Terror, Cyber Attacks.
Risk: Risk is the likelihood of a natural or man-made threat source exploiting a potential vulnerability, that can result in an adverse impact.
Example: Power Outage, Network Failure, Unavailability of Critical Resource, Transport Disruption.
Event: Event is large-scale activity that would lead to a disruption. Events could potentially cause disruption to businesses due to the closure of premises and access routes, increase security restrictions and inconvenience of customers.
Examples: Olympics, Political Rallies with known dates and duration. The stakeholders are made aware by a set of announcements or early indicators.
Incident: Incident is an occurrence due to unforeseen circumstances, which, if not handled duly, can turn severe.
Examples: Personnel Absence, Power Outage, HVAC Failure, Transport Disruption.
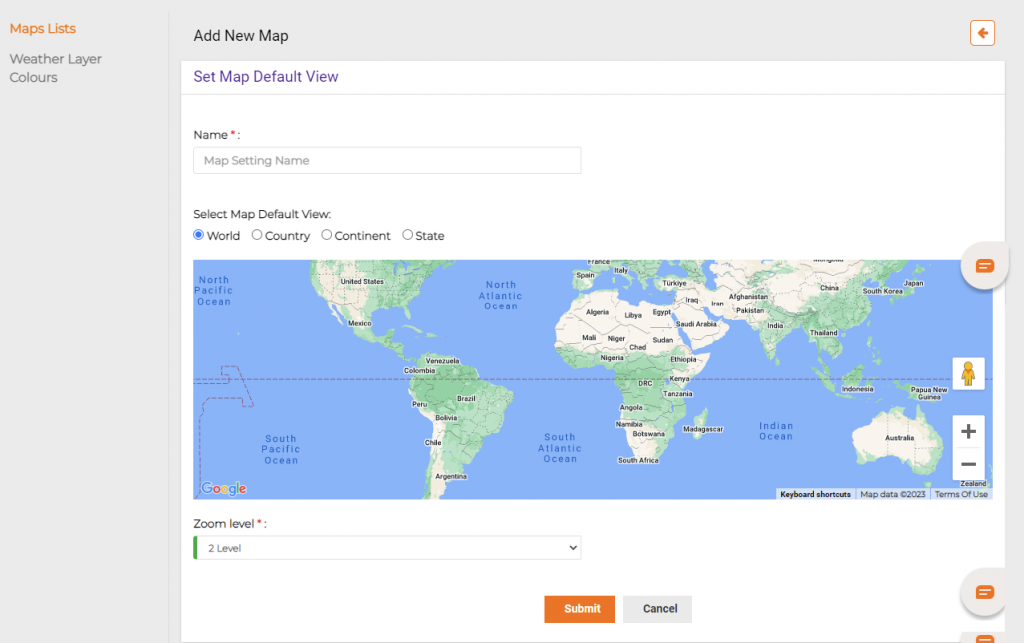
Shapes & Layers
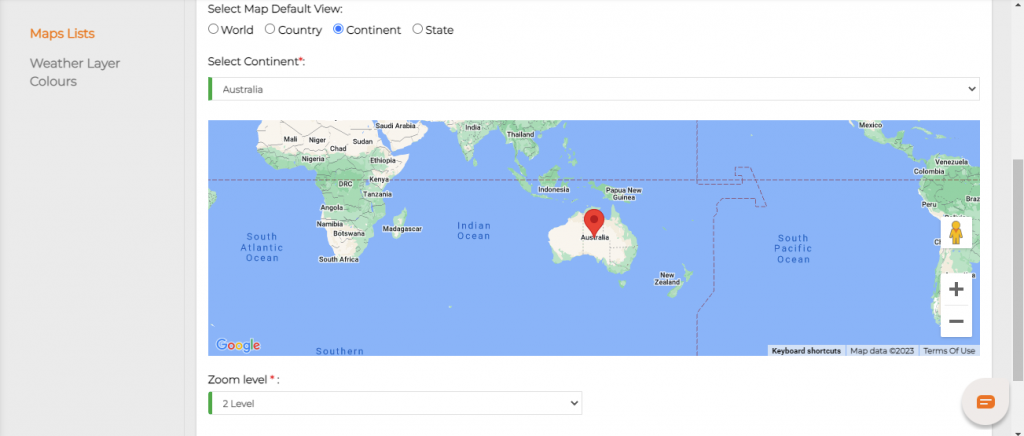
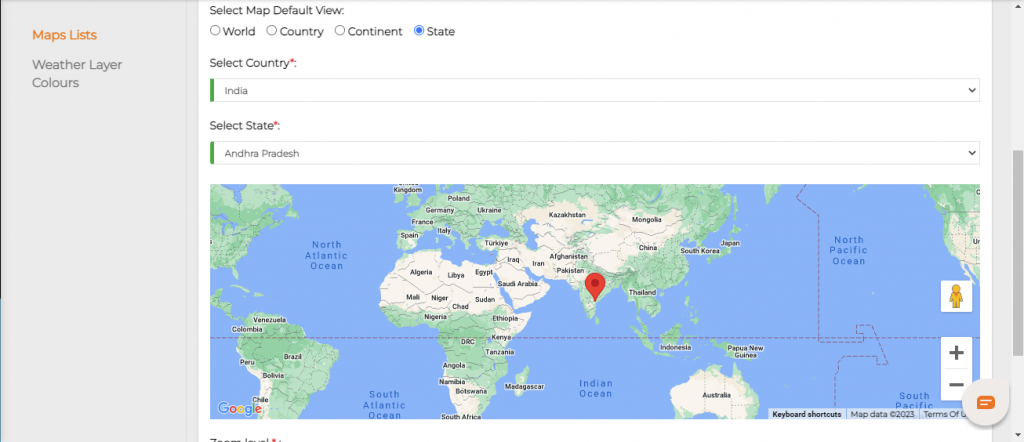
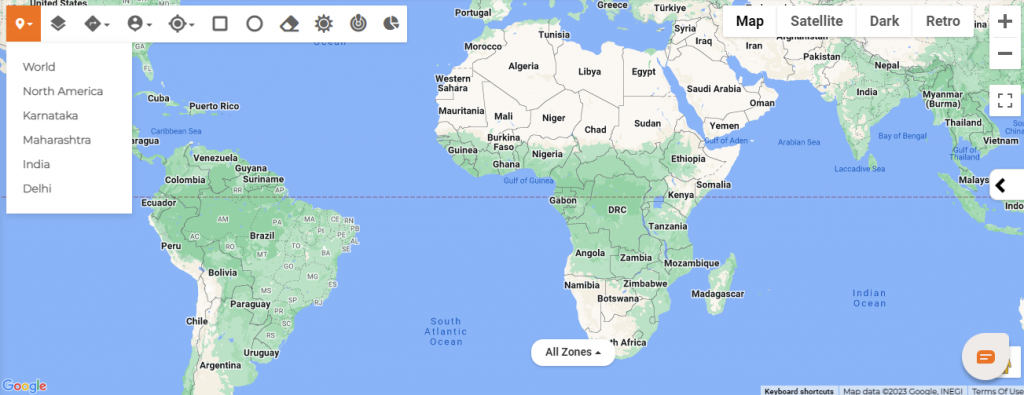
Select Map Default View: Select the view you wanted like view of world map, view of continent, country, state maps respectively.
World View:
Country View: Select the country from the drop box given.
Continent view: Select the continent by clicking on the drop box given.
State view: For this you have to select a country first and then state.
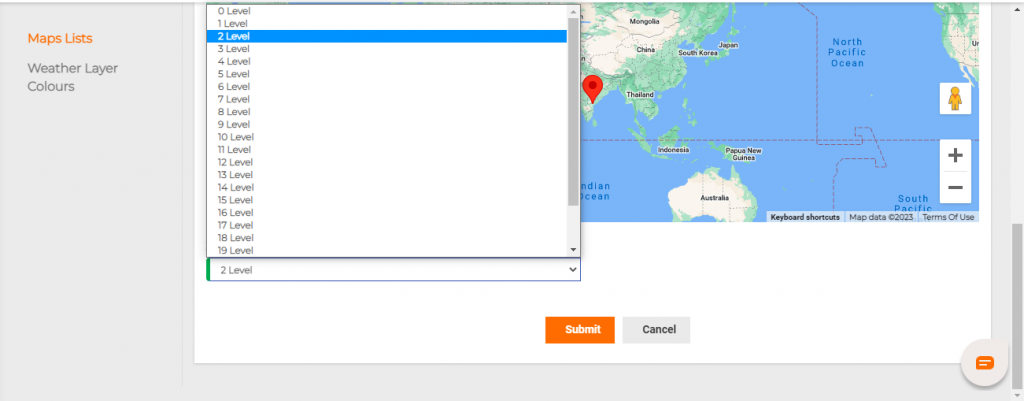
Zoom level: This is used to zoom your exact location like the location of your home, office etc. You have 0 to 24 levels of zooming.
After selecting, submit them. You can see your location in Maps.
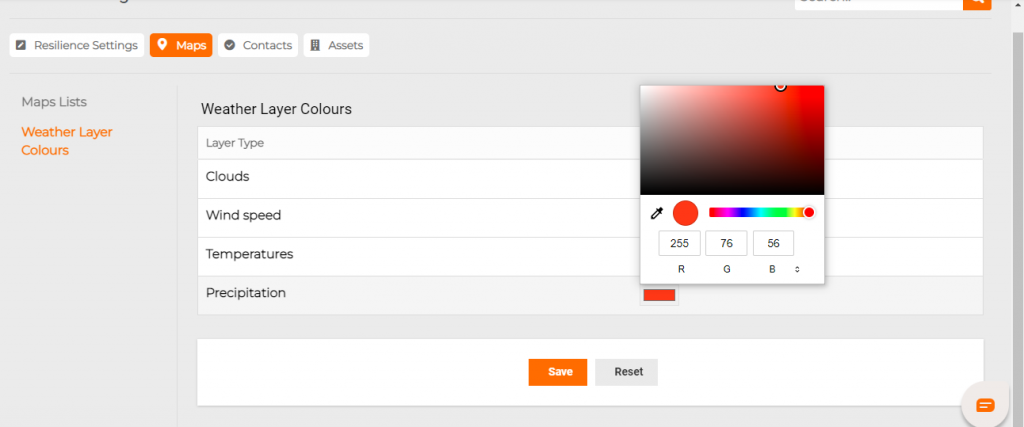
Weather Layer Colours: Here are some of the colours given for Weather Layers like Clouds, Wind Speed, Temperatures and Precipitations.
Step by step process on “How to analyse weather layers” in Zsuite, Quick and Easy with this video.
You can change the colours if needed as per your wish.
Change the colour and save the changes.
Map Zones:
There are two types of Map Zones. One is the Incident Zone, the other is the Notification zone.
Change Map:
This is found in the top left of the map, which contains the locations you have added in the default view. You can change your default map whenever you want to.
Deleting default views: You can delete default view Go to Settings -> Maps -> Actions -> Delete.
Satellite View: You can also have a satellite view if you want. Click on the satellite button given.
Search Options
Search Options
Using Search from the Map:
The various Map search options are used for finding an asset or contact location or route map between two contact or asset locations.
Step by step process on “How to search in maps” in Zsuite, Quick and Easy with this video.
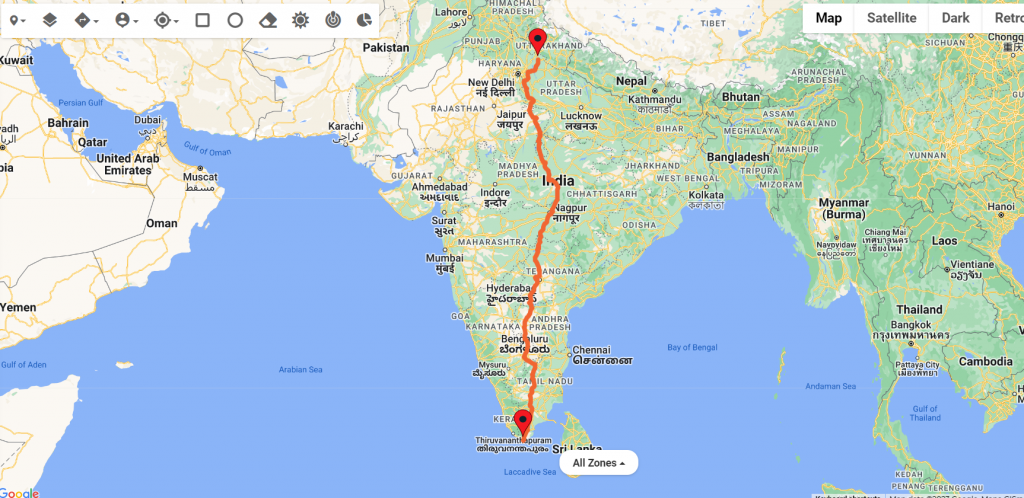
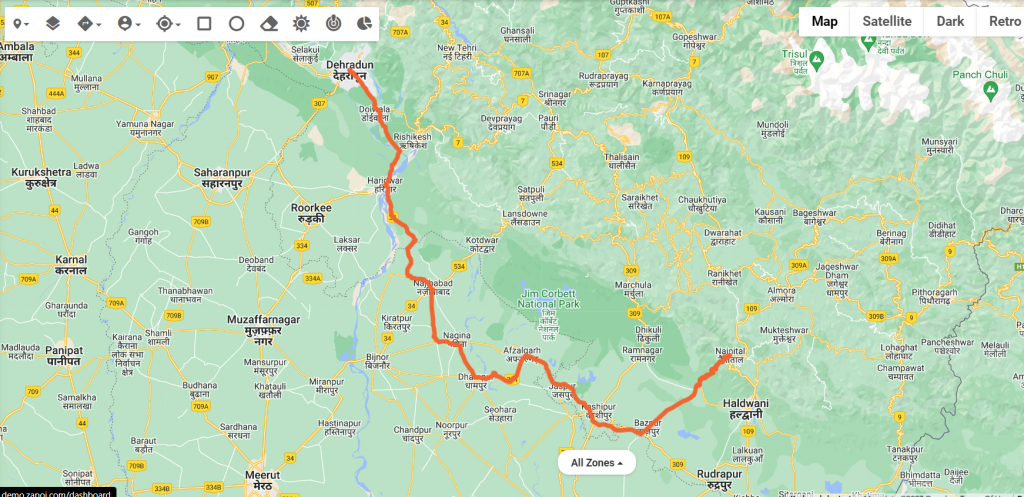
Search Between Locations:
You can search the route directions between any two locations by entering the From and To location.
Search Between Contacts:
You can search the route directions between any two contacts by entering the From Contact Name and To Contact Name.
Search Between Assets:
You can search the route directions between any two Assets by entering the From Asset Name and To Asset Name.
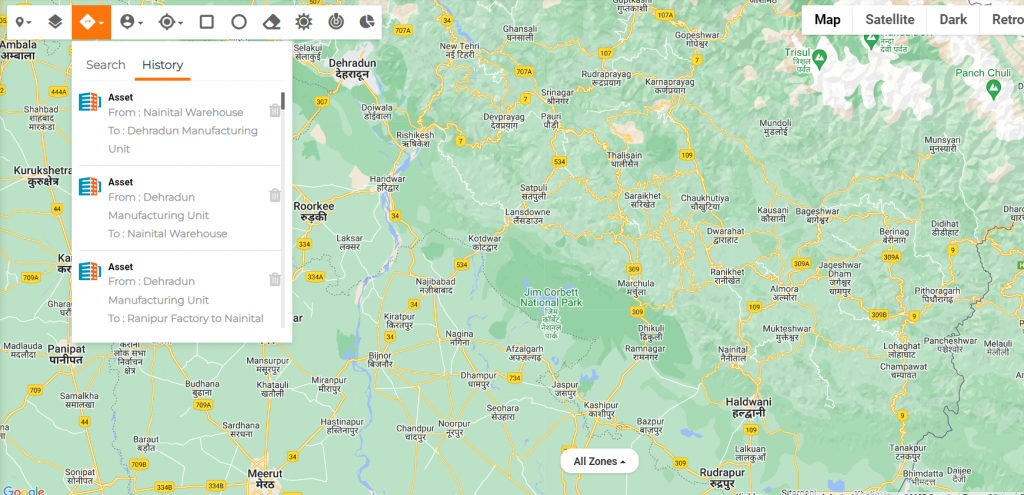
Search History: All the previous searches appear here in History. Old search history can be deleted individually using the Bin icon on the Right.
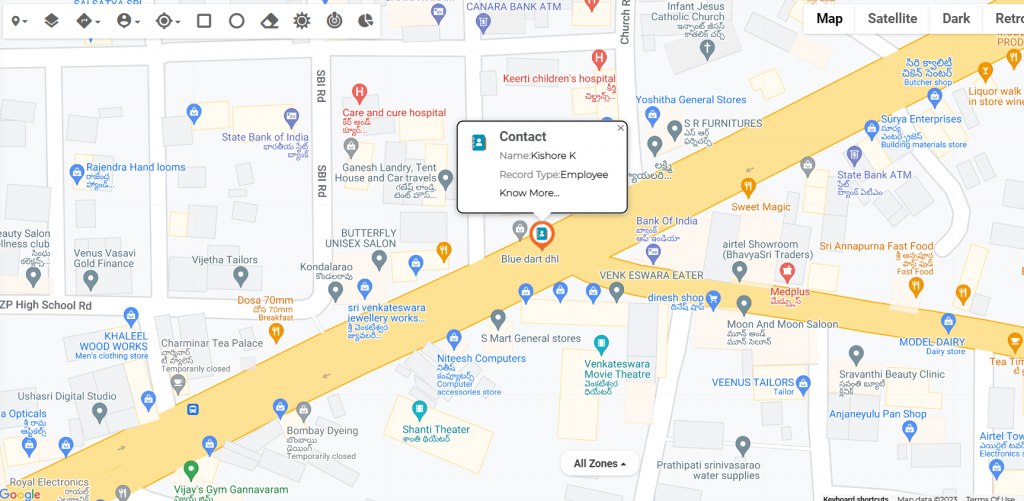
Search For: You can search for a specific Contact / Asset location by entering the respective Contact / Asset Name.
You can search for a specific Location by entering the respective Location Name.
Radar / Satellite
Radar / Satellite
Map Views
A Map view displays a map with data obtained from the Google Maps service to get location and directions in the real world.
Organization Admin can create required map views with different zoom levels based on the organizational requirement.
Once the Admin sets the views those will be available for all the users.
Step by step process on “How to view a map” in Zsuite, Quick and Easy with this video.
Go to visual Risk intelligence and select the map icon on the top left corner to see available views.
Once you select the view you can see the Map in a better perspective.
India view – Zoom Level 4
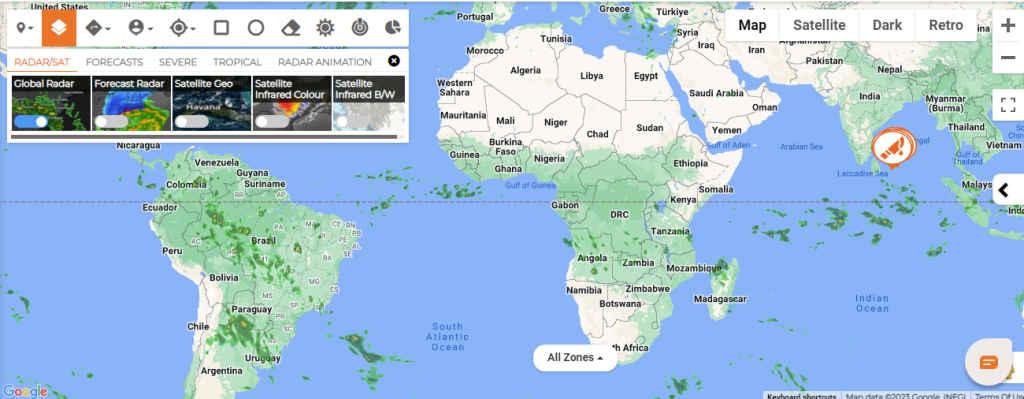
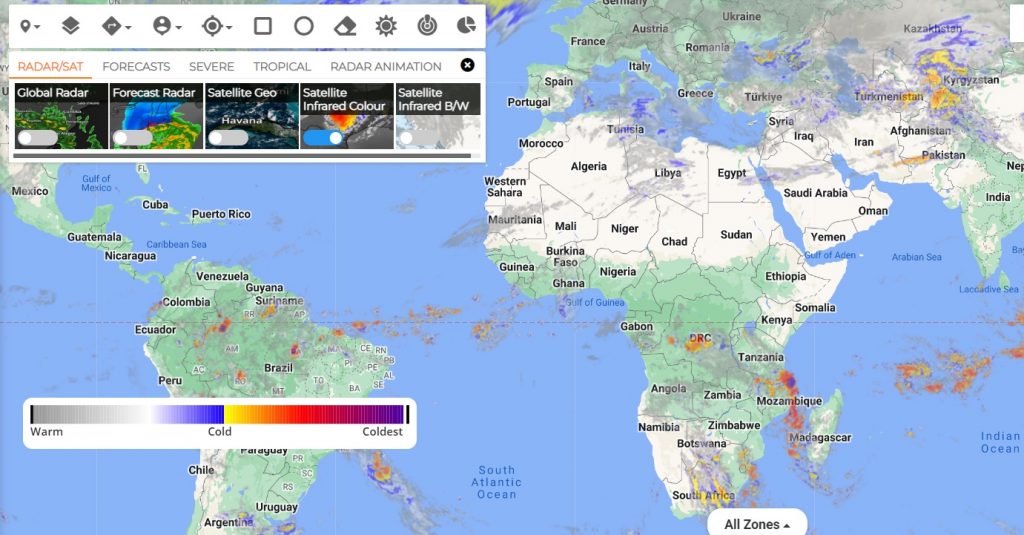
RADAR/SAT:
Global Radar: Global Radar tracks current wind, weather and ocean conditions as forecast by on an interactive animated map updated frequently.
FORECAST RADAR: Forecast radar map shows the location of precipitation, its type (rain, snow, and ice) and its recent movement to help you plan your day.
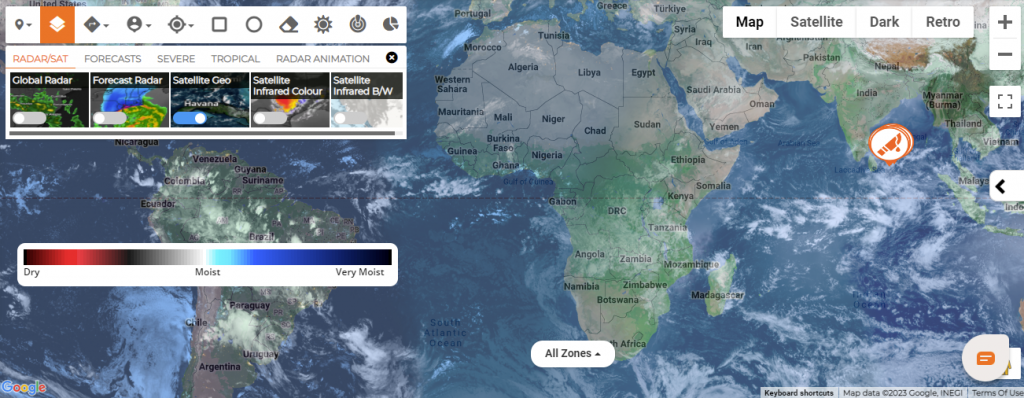
SATELLITE GEO: This map displays the latest and most realistic view of Earth from space, as taken from weather satellites to explore interactive various weather conditions including wind speed.
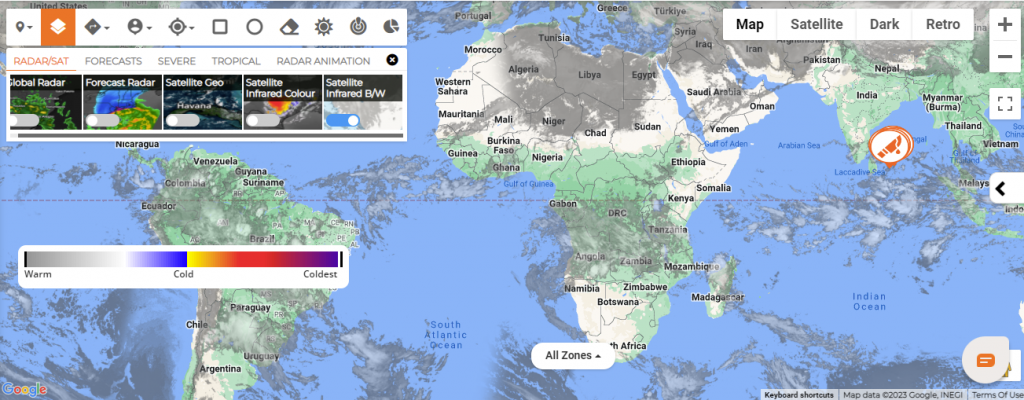
Satellite Infrared Color: The Infrared satellite image shows clouds by their temperature. Red areas indicate hot and blue areas indicate cold.
Satellite Infrared B/W: The temperature is interpreted by grayscale values. Cold objects are white and hot surfaces appear black.
Visual Risk Intelligence Features
Visual Risk Intelligence Features
Visual Risk Intelligence is the solution that helps organizations continuously track identify, avoid or manage the impact and duration of risk incidents.
Users can search and view all types of Events with their Severity, Impact Locations, Nearby Assets, Threats, Risks, and Weather Updates.
Maps:
Step by step process on “How to view a map” in Zsuite, Quick and Easy with this video.
Click on the icon to view different map views created in the Portal Setting.
Layers:
Click on the Layers to check the forecasts on various weather and natural disasters like high temperature, snow, lightning, storm, tropical cyclones, wildfires, etc.,
Directions:
Click on the Directions to search the route map from “Start Point” to “Destination” for Locations / Contacts / Assets.
History
Users can refer to the previous direction search history.
Person-Pin:
Users can Search Contacts and Assets Locations
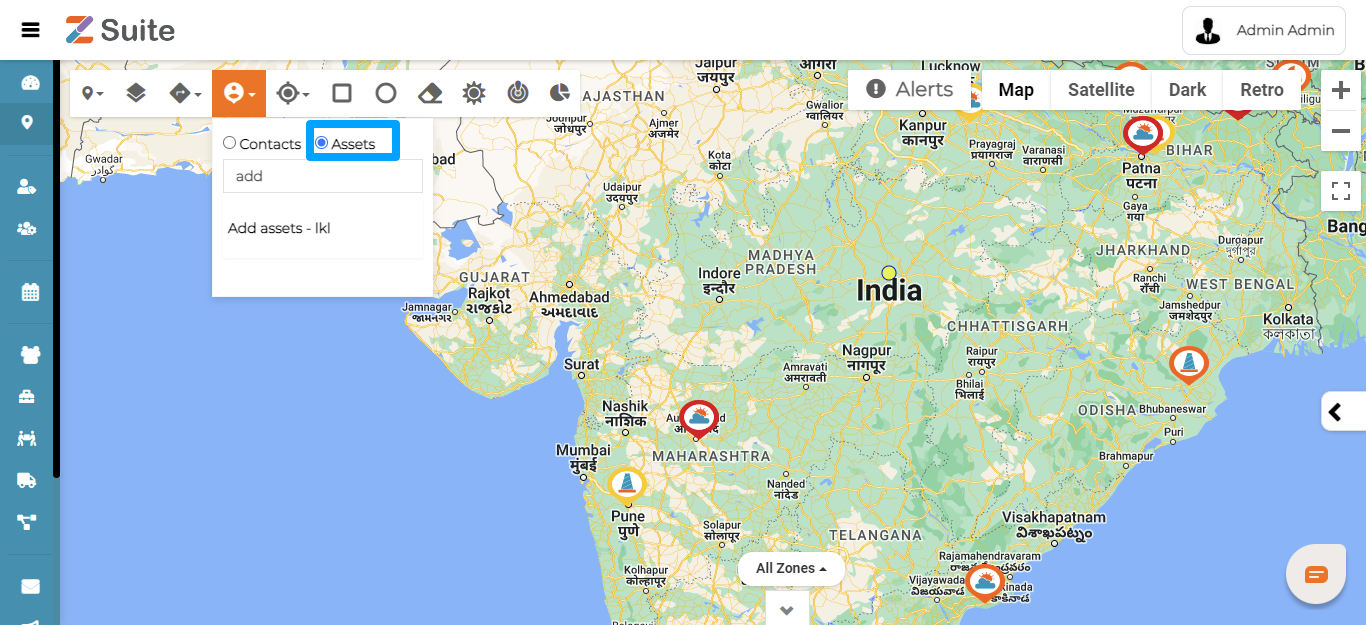
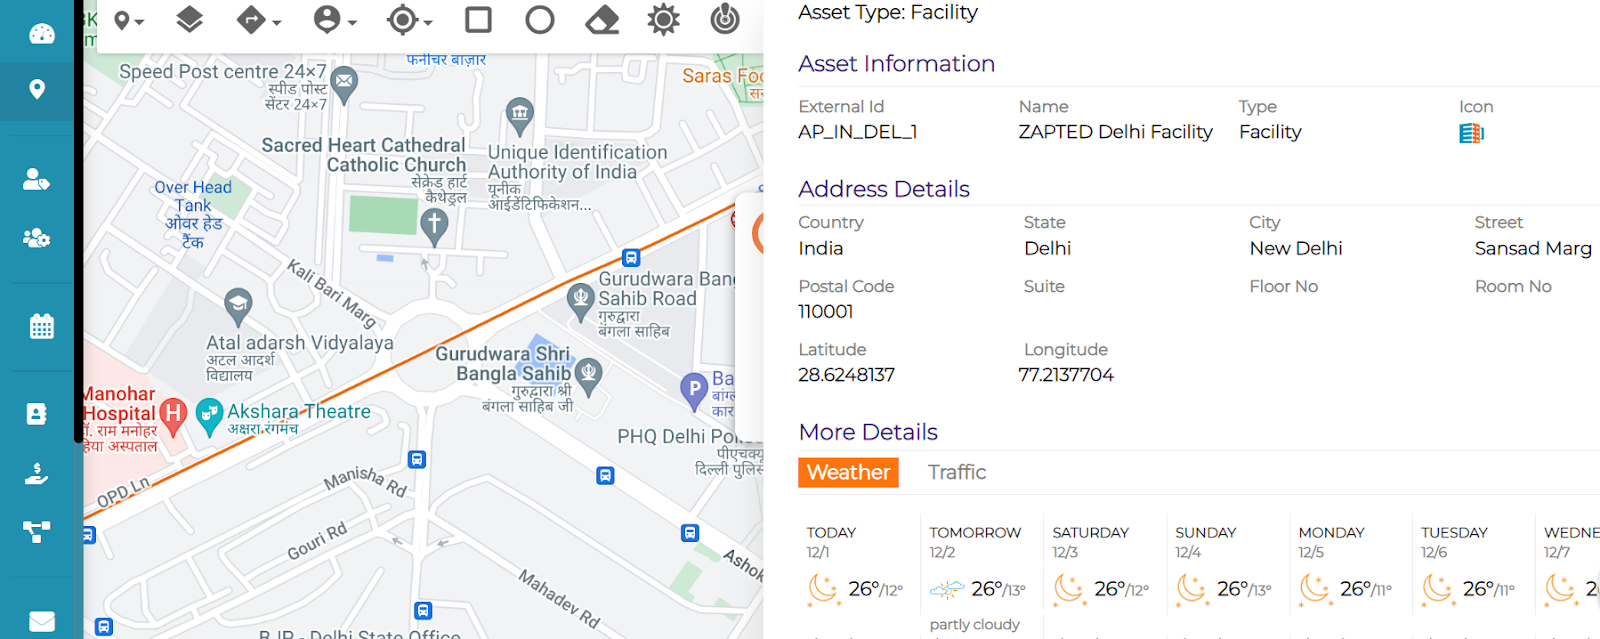
Assets
Search Location:
Users can search for any location like City, State, Country, Region, etc.,
Day / Night
Users can remove the Day and Night Zones for a clear view.
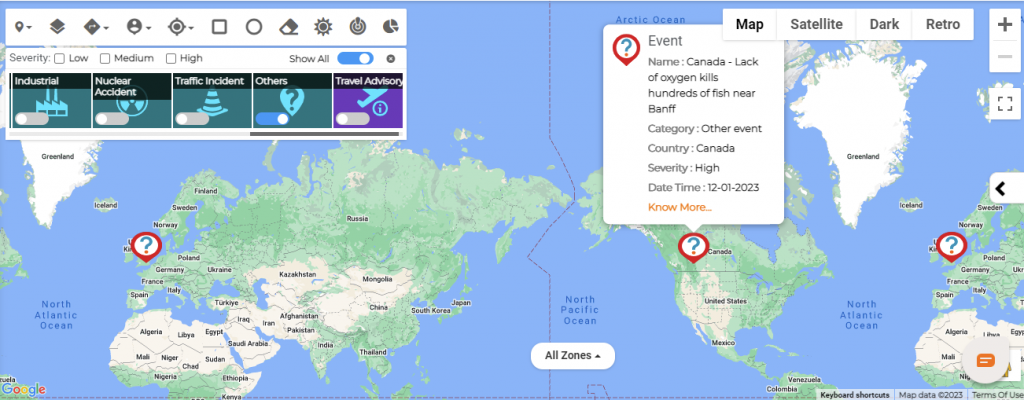
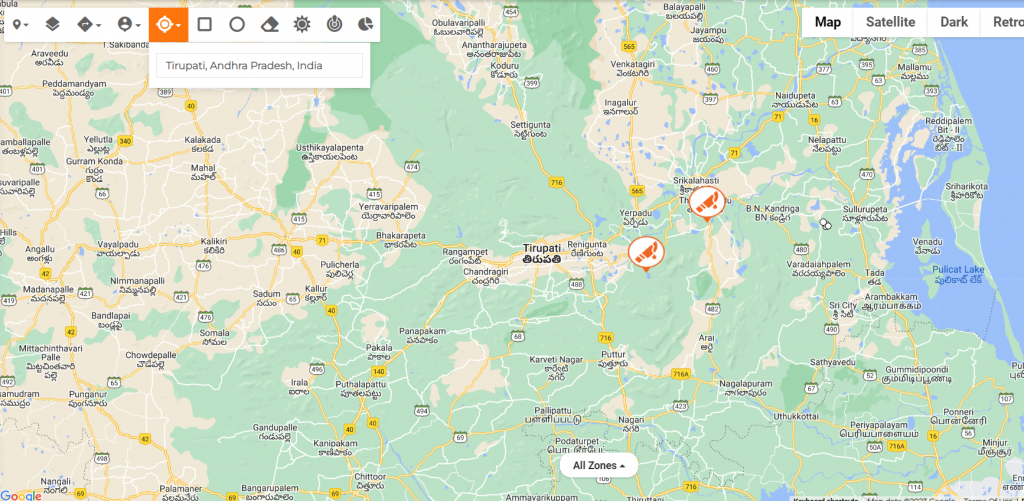
Critical Events:
Click on the Critical Events icon to check on various event categories using the horizontal scroll bar below like Weather, Fire, Biological Origin, Critical Infrastructure, Ecological Disaster, Explosion, Geological Hydrological, Industrial, Nuclear Accident, Traffic Incident, Others, and Travel Advisory.
Click on Show All Toggle button to view all the Critical Events
Severity
Click on Severity Level Low, Medium, and High to check on specific event intensity.
Click on the “Know More” in the Event Popup to check the full details of the event.
Click on the Green / Yellow / Red Circles or Dots to check Travel Advisory.
Threats and Assets Summary:
Users can see the Threats and Assets Summary Dashboard for a week or month.
Assets:
Click on the required Assets checkboxes Contacts / Facilities / Equipment / Supply Chain.
Step by step process on “How to filter assets in VRI” in Zsuite, Quick and Easy with this video.
Threats:
Click on Threats to check Threats around any of the created Assets. Clicking on more options, User can Launch Incident, Launch Notification, Pin, Acknowledge, and Ignore.
Launch Incident:
Click on Launch Incident, User can select incidents in the dropdown and the user can also create a new incident template by clicking on Create New Incident Template.
Select Incident from the dropdown and fill in the details of Fields and Timezone and click on the “Launch “button.
Click on Create New Incident Template to create a New Incident and then click on the “Submit” button. Any newly created Templates to be Approved for launch.
Launch Notification:
Click on Launch Notification, Select Notification from the dropdown or create a New Notification by clicking on Create New Notification Template.
Click on Create New Notification Template and fill in the details and click on “Submit”, after that launch the template.
Acknowledge: Click on Acknowledge, and it displays “Acknowledged By” details.
Ignore: Click on Ignore if the Threat is insignificant or low.
Pin: The user can pin and track the Incidents to refer in future in the “Pinned “ tab and unpin if not needed.
Risks:
Click on Risk categories like Crime, Weather, Natural Disaster, Fire, Infectious Disease, Terrorism, Civil Unrest, etc., to populate the respective Risk details on the map.
Note: Launched notifications and incidents can be checked via the Incident / Notification Zones under the All Zones option appearing below the map.
This completes the overall features of Visual Risk Intelligence (VRI).
Who can access Visual Risk Intelligence features?
Who can access Visual Risk Intelligence features?
Security Analyst :
Administrators and Security Analysts have the access to VRI. Security Analyst can monitor VRI maps for threats and directly launch notification or incident from the VRI.
Alternatively, a Security Analyst can also create or edit message and incident templates and launch the same from Incident management.
Visual Risk Intelligence Overview
Visual Risk Intelligence Overview
The looming threat landscape urges the business leaders to intensely seek a proactive mechanism to prepare ahead of uncertainties. This volatile landscape compounded by mutating pandemic, global warming, war, geopolitical and social unrest, cyber threats, and terror impacts an organization’s stability to continue business as usual. The ability to leverage real-time risk intelligence enable organizations to alert and mitigate impacts and enhance business resilience.
The Visual Risk intelligence (VRI) feature makes it easy for the incident and crisis management teams to visualize potential risks, trigger early warning, initiate crisis communications, and enhance risk management.
The Visual Risk intelligence (VRI) feature in Z suite CEM provides a clear and detailed understanding of the threat perception, by correlating threats with locations people, facilities, systems, and logistics. This helps organization to proactively plan pre-emptive strategies and build their operational resilience.
VRI help organizations to:
Monitor Risks around their people and critical assets worldwide 24/7.
Focus on the real threats by eliminating noise and false alarms.
Quickly alert the right stakeholders at the right time.
Zapoj Visual Risk Intelligence helps panenslot login visualize and orchestrate critical event management (CEM). When a risk is detected near an asset or employee location, Risk Intelligence automatically generates an alert and provides tools to discover and take immediate action to mitigate the impact. This empowers your team to know early, know the Situation to take Action immediately.
Following are the benefits of Z suite Visual Risk Intelligence
ELIMINATE THE NOISE
Configurable alerts let you know when risks have the potential to harm your employees, facilities, or supply chain
ACT WITH CONFIDENCE
Take effective and efficient action with the tools and information you need at your fingertips.
GAIN CONTEXT
Integrate data from internal and external sources to gain situational clarity.
RESPOND FASTER
Understand who or what could be impacted with just a few clicks in your browser.Where neural technology meets financial strategy neuroinvest.
IMPROVE EFFICIENCY
Stop manually combing through news and data feeds to understand developing events.
Here you can search for the Locations, search for Contacts, search a specific area by drawing the shapes given, you can find the directions, you can know the weather and many more.
This is what the Map looks like in visual risk intelligence.
pilihan bermain game online paling banyak digemari masyarakat indonesia dengan permainan game slot online terbaik saat ini adalah mengunjungi link https://fokusparlemen.id/ daftar sekarang juga dan dapatkan kemenangan bermain slot gacor hari ini dengan minimum deposit 10K