
Dashboards in detail
Dashboards are useful in monitoring, measuring, and analyzing the current state of a business, department, team, or specific process. Dashboards helps to track periodic progress, spot signs for early warning, identify areas of improvement, and make timely decisions.
Step by step process on “Feature Details” in Z suite, Quick and Easy with this video.
Select “Dashboard” from the menu options listed in the left pane.
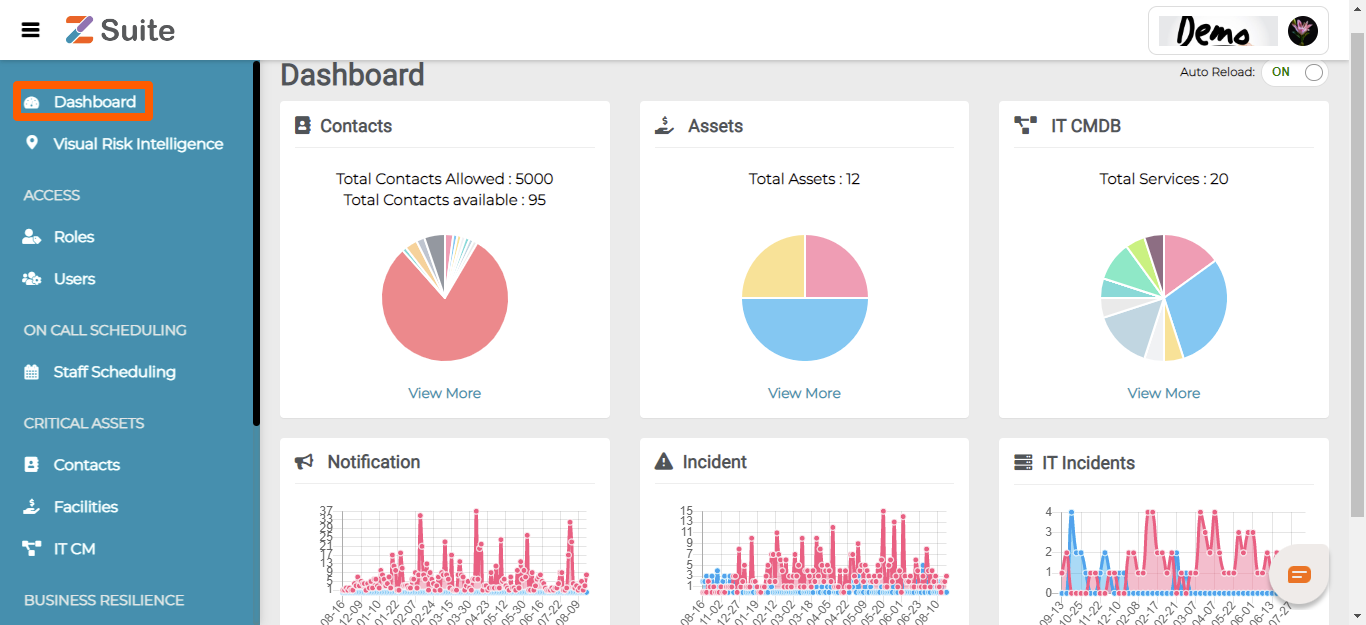
Here you can see the respective dashboards for “Contacts”, “Assets”, “IT Services”, “Notifications”, “Incidents” and “IT Incidents”.
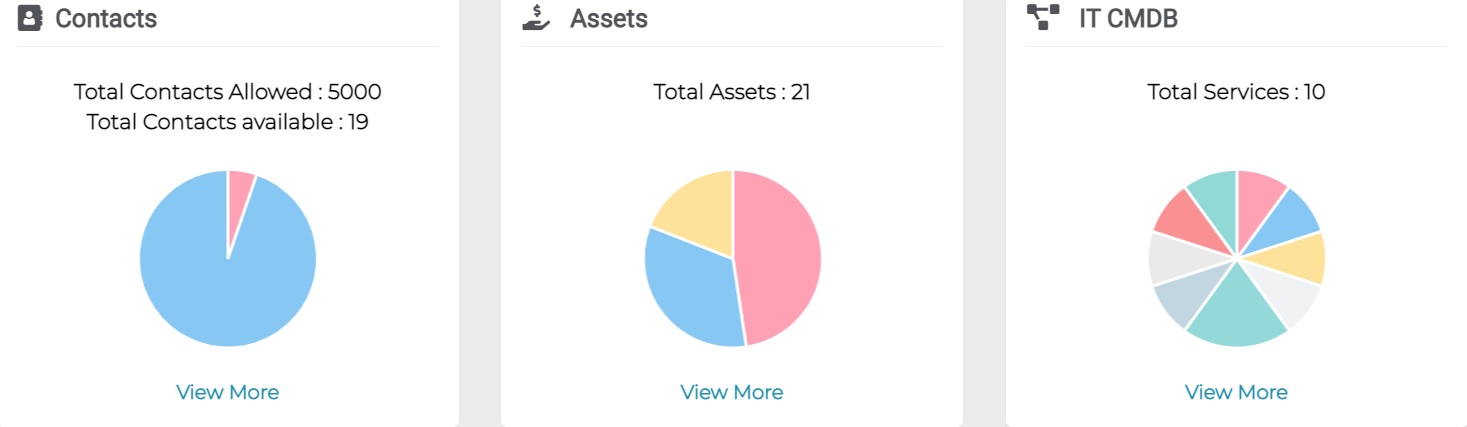
Contacts:
This is the Overview of Contacts.
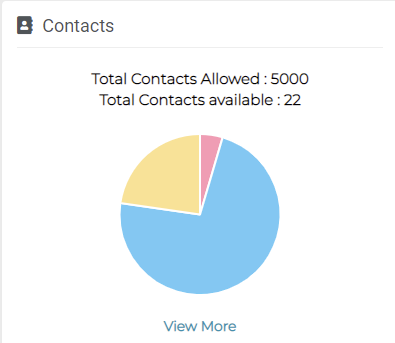
Total Contacts Allowed are the Contacts that the Organization can add i.e., here you can add up to 5000 contacts. Total Contacts available are the Contacts you have at present.
Each colour in the graphical chart indicates a specific Contact Type like Employee, Manager, Customer, Supplier etc. Clicking on the View More option will redirect to the detailed view of Contacts.
Assets:
This is the Overview of Assets.
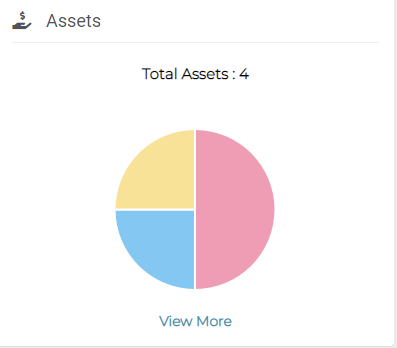
Total Assets are the Assets that the Organization have added and available at present.
Each colour in the graphical chart indicates a specific Asset Category like Facility, Equipment and Supply Chain. Clicking on the View More option will redirect to the detailed view of the Assets.
Services:
This is the Overview of the Services.
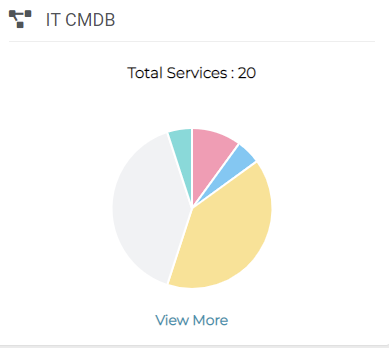
Total Services are the Services that the Organization have added and available at present.
Each colour in the graphical chart indicates a specific Service. Clicking on the View More option will redirect to the detailed view of the Services.
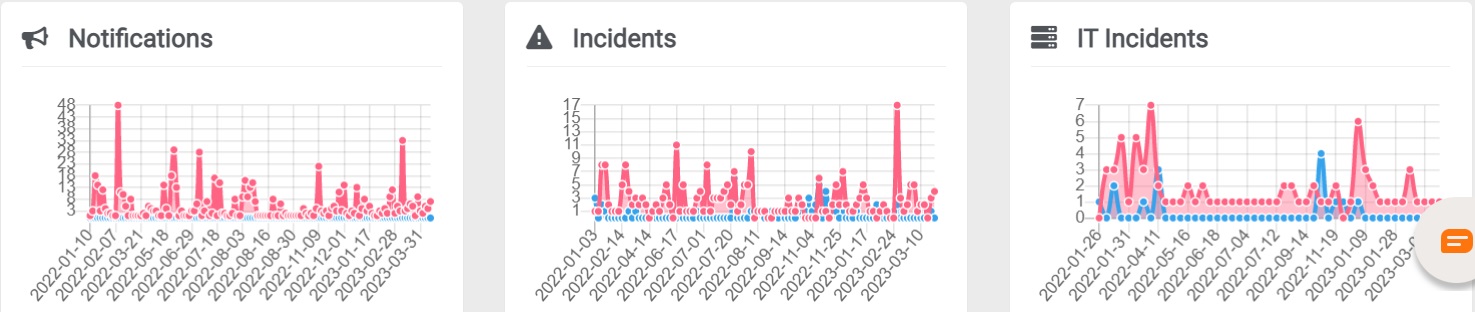
Notifications:
The Notifications Graph shows the number of Notifications triggered date wise.
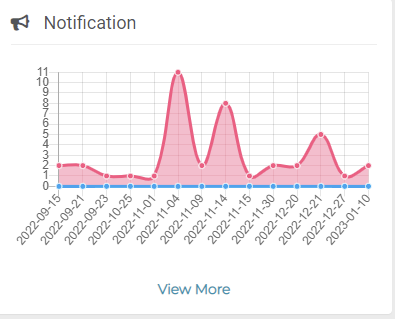
Clicking on the View More option will redirect to the detailed view of the Notifications.
Incidents:
The Incidents Graph shows the number of Incidents triggered date wise.
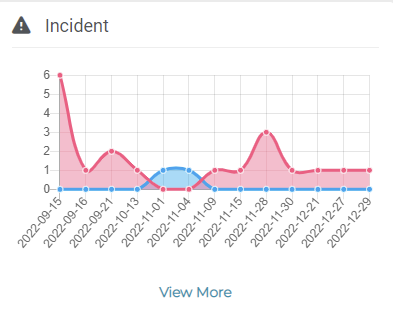
Clicking on the View More option will redirect to the detailed view of the Incidents.
IT Incidents:
The IT Incidents Graph shows the number of Incidents triggered date wise.
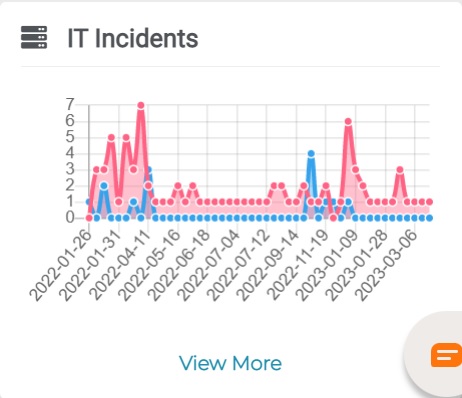
Clicking on the View More option will redirect to the detailed view of the IT Incidents.